
Weekly post for 8/21
Jackson Hole

Disclaimer: Any analysis you see here is meant for educational purposes and is not trading advice. Any trades or investments made using this are entirely the reader's decision based on their evaluation of the risks and market knowledge.

Recap: 4325, the key level we have been talking about for a couple of weeks, came into play on Friday at the open, and bulls have held the level so far. In Thursday’s post, I tried to summarize my view of this year, and I also shared my view on why bears have an edge at this point but need to take out the key levels with specific structural changes; otherwise, bulls can step back in.
Today's post is very technical as well as educational. First, I am going to go deeper in the long-term chart of the SPX and share an overall view of what has been going on since 2009, and then I am going to get into a little more of a technical aspect of what structural formations we are looking at for both bearish and bullish scenarios, as I think next week will make more progress towards that.
I want myself and every reader of mine to be prepared for what is coming next. If it’s a continuation of the uptrend, then I don’t want to be sitting short, but if what I shared last week around my original thoughts from February are coming to fruition, then I want to make my short positions. At this point, I don’t have many open positions; I closed all my short-term options, and I am looking at what the next 3 months can look like.
Before we get into the charts, I want to share some Structural aspects of Elliott waves and then compare them with the charts of SPX. I hope that will bring more clarity to you.
Elliott Waves are defined by two wave patterns: Impulsive and Corrective. Impulsive waves are the waves that are directional and are formed as five waves, but corrective waves are the retracements of the directional move and are formed as three waves. Showing a very basic example of an Elliott Wave where we first have a 5-wave impulse.
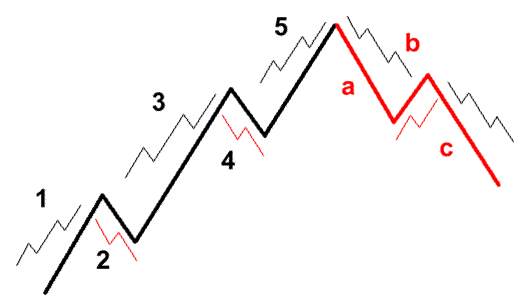
The aforementioned structure is an illustration of an uptrend with an impulse of five waves (1-2-3-4-5), followed by a corrective wave of three waves abc. Note that each of these waves has subwaves; for example, waves 1, 3, and 5 move up with 5 subwaves in them, and legs 2-4 come down in a 3-wave ABC corrective structure.
On the other hand, the large move abc post-wave 5 of impulse consists of subwaves, which are divided into 5 waves for waves a and c, but the counter trend move b within that is a 3-wave structure. This is a very simple example of a corrective move, which is also called a zigzag structure, and there are many formations that could take place for corrective moves, be it FLAT, triangle, or a combination of the different patterns to make complex structures.
Now take the SPX monthly chart and compare it with the above example.
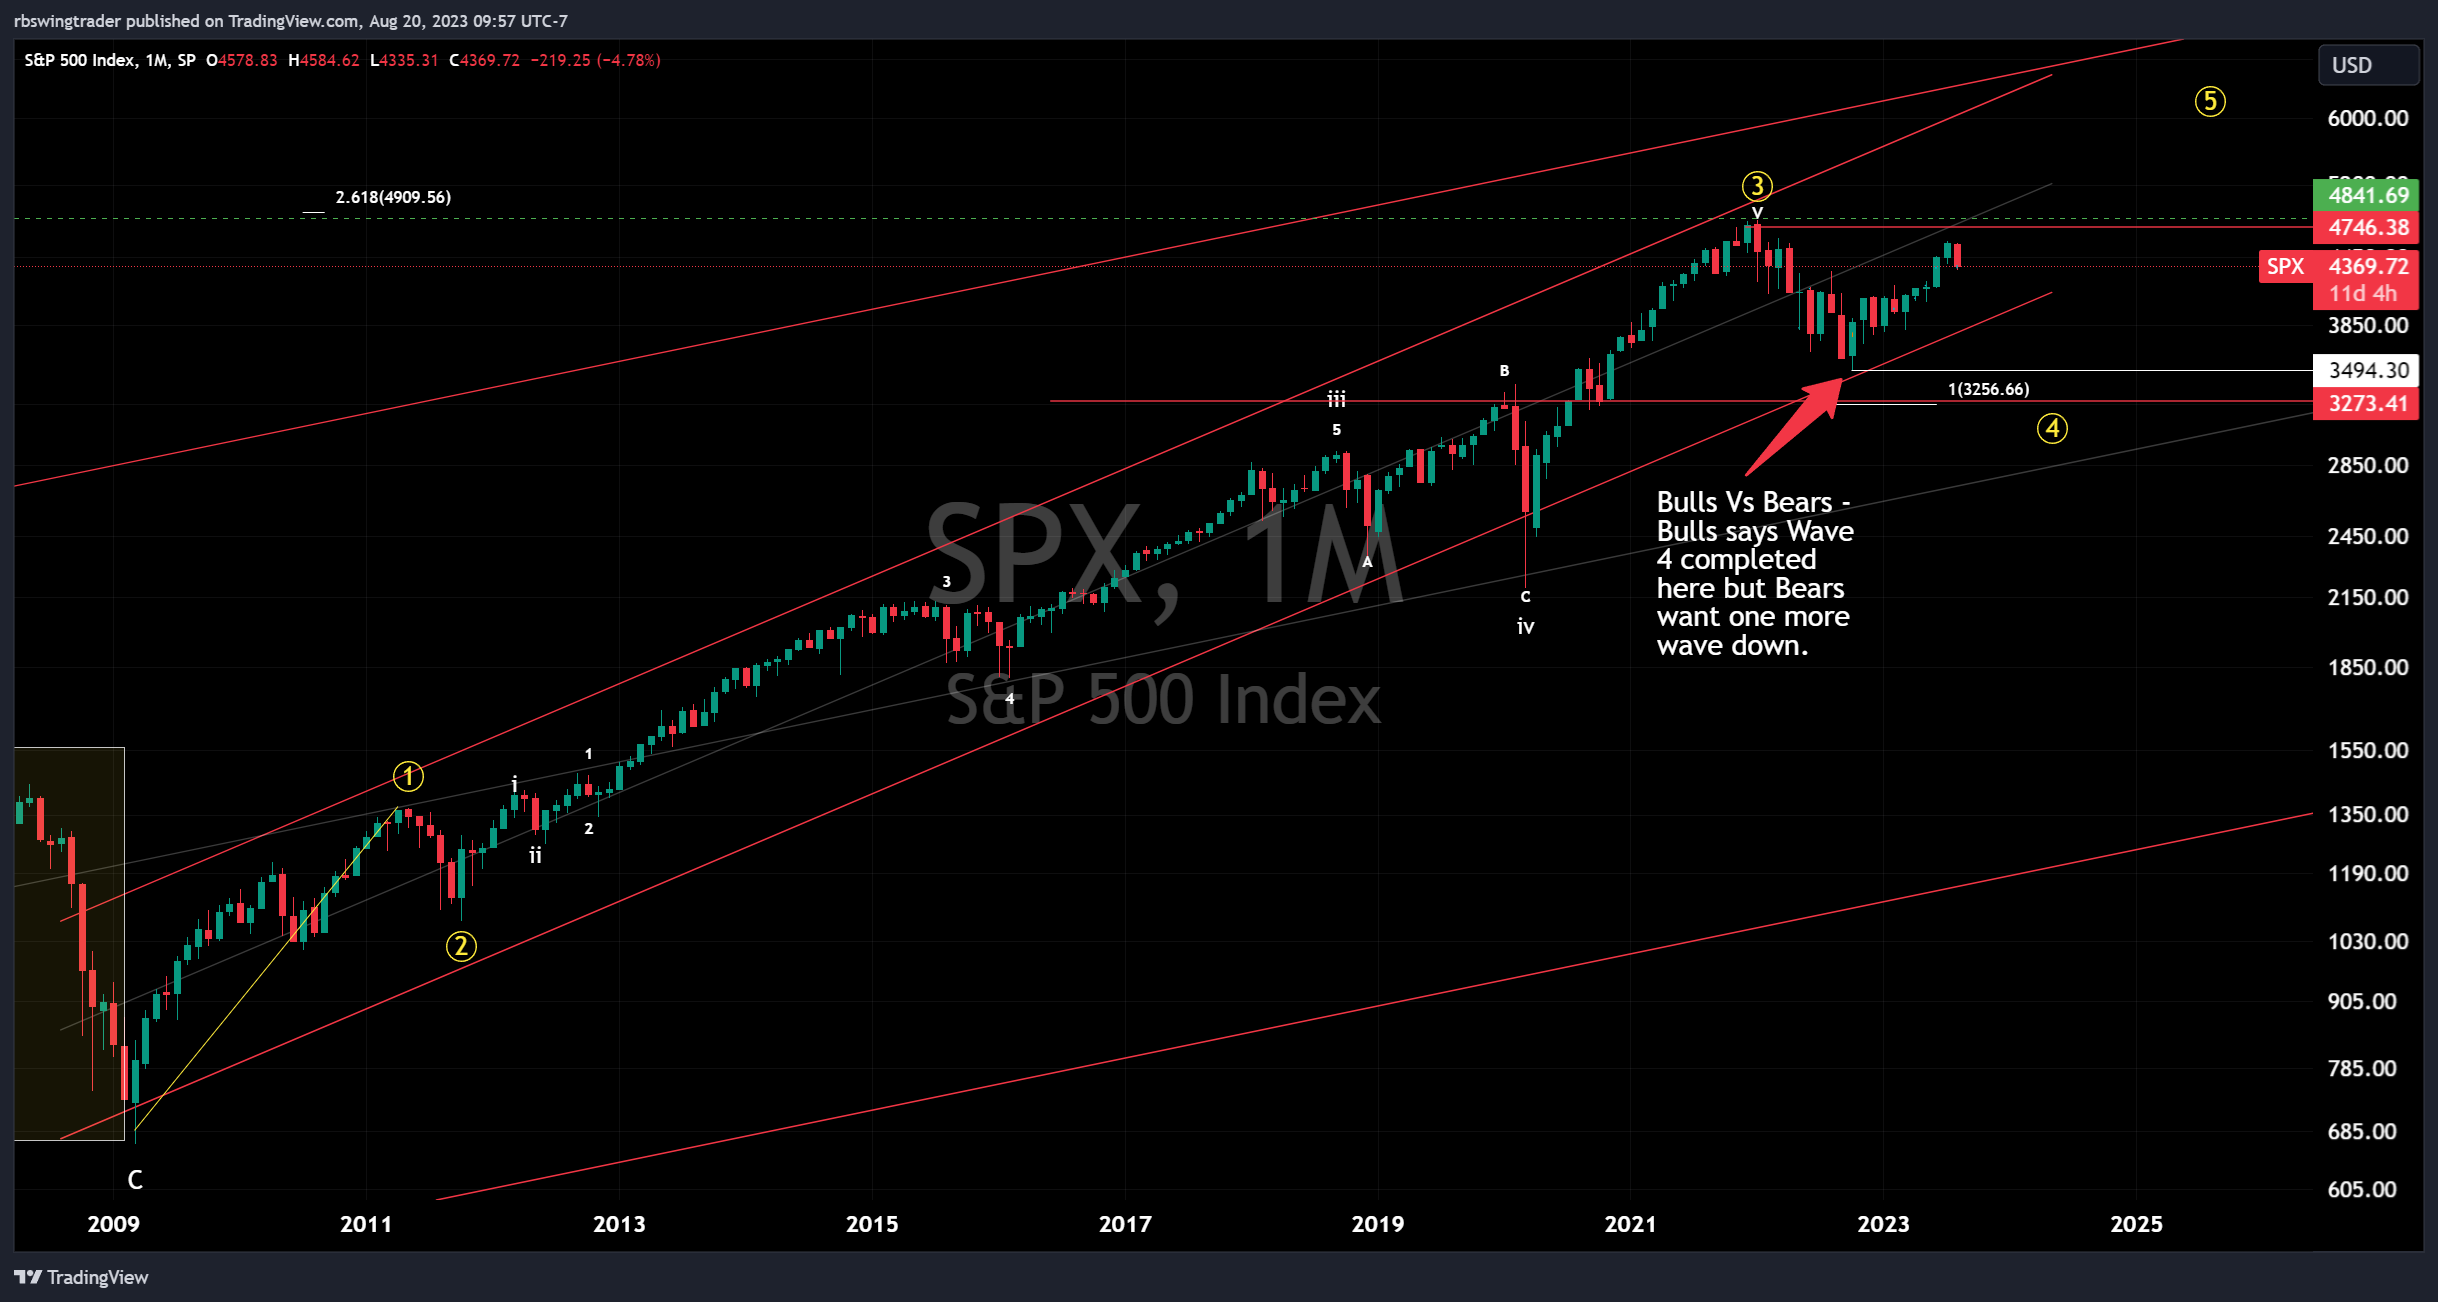
You see clearly that there is a trending impulse that started back in 2009, post-recession, and we had dips along the way in 2011, 2016, 2019, and then 2020. The dip of COVID 2020 marked the C leg of Wave 4, and the point to note is that Wave B actually was higher than the previous wave “iii” high. It is possible within the expanded Flat correction, and I have shared the formations below in this post. The point to note is that this was still a sub-wave “iv” correction of a larger Wave 3 move, where the momentum is at its best, and the time it took from where it is marked as iii to iv was from sept 2018 to march 2020, about 18 months.
Now the correction, which started in 2022, has dropped the market from 4800 to 3500 and started a major wave 4 correction after the completion of a large uptrending Wave 3. The Key points of battle between all the bulls and bears hang on the theory that bulls say that Wave 4 was completed when SPX touched 3500, but bears don’t agree since the correction 4 is a correction to a 10-year-long trend that started in 2012, post the last FITCH downgrade dip of 2011.
Now Bears have a valid point that, going with the Fibonacci retracements to price and time, the retracement was lower than an expected value, and the time of 9 months spent in 2022 wasn’t sufficient to mark it Wave 4 at least when you see that previous sub iv took 18 months, and there should be one more leg down towards 3200, so the retracement is at least 23% with price and almost with time as well since by the time we get to 3200, we will be almost 2 years + into this correction. It can be more, and these are minimal expectations.
Bulls have been riding on the Fed money and the money sitting on the sidelines to mark wave 4 complete in October 2022 and take it all the way to 6000 now as part of Wave 5.
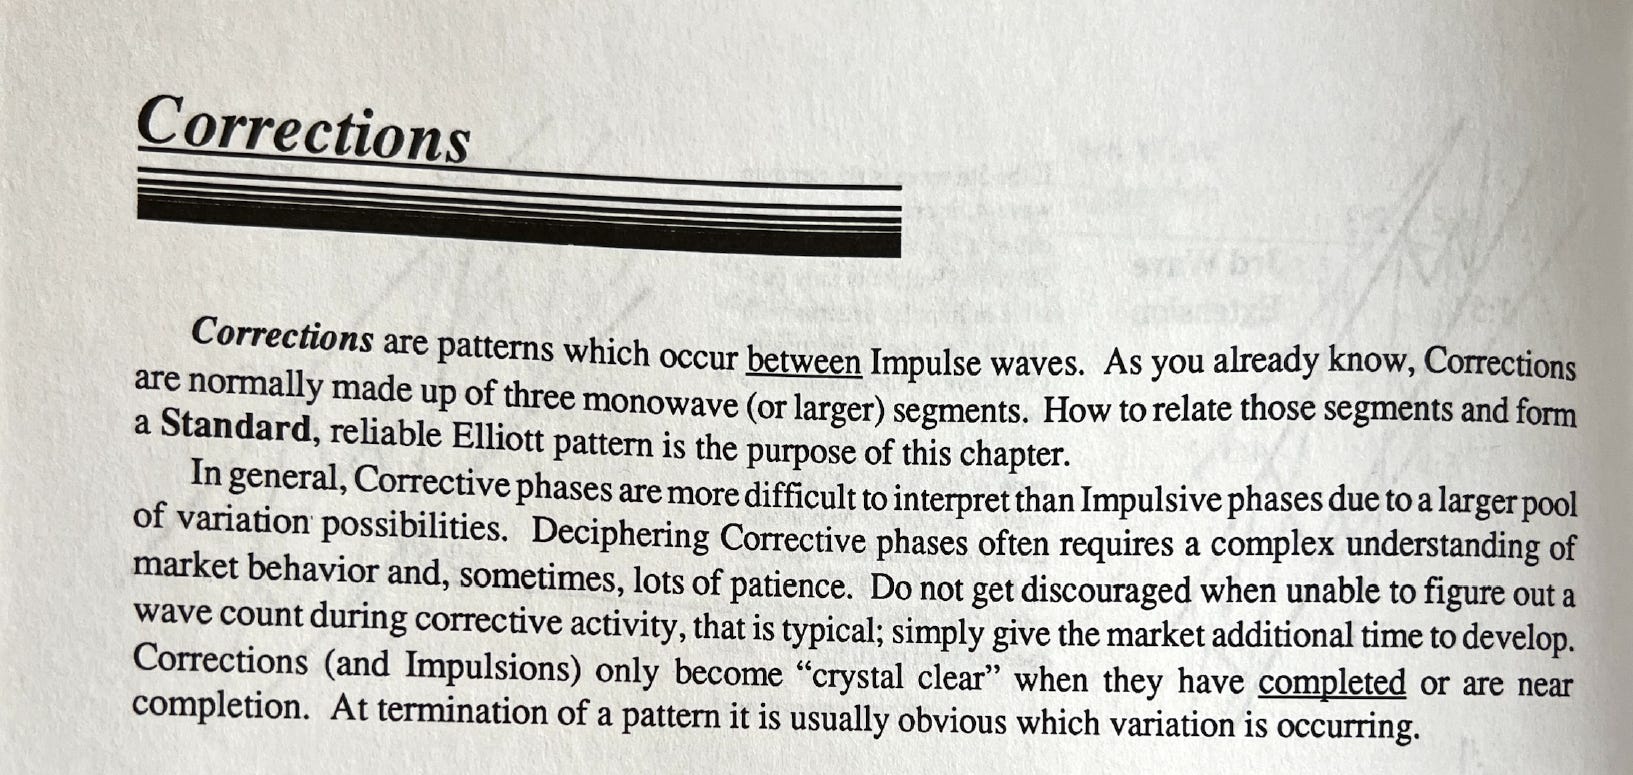
Now the most interesting part comes here: Trading corrections is the most difficult one to interpret and trade, as it can take any form of correction. Here is just some text from one of the books:
Wave 2 corrections are more often a Zig Zag, which is easier to breakdown, but Wave 4 can take any formation, as shared below.
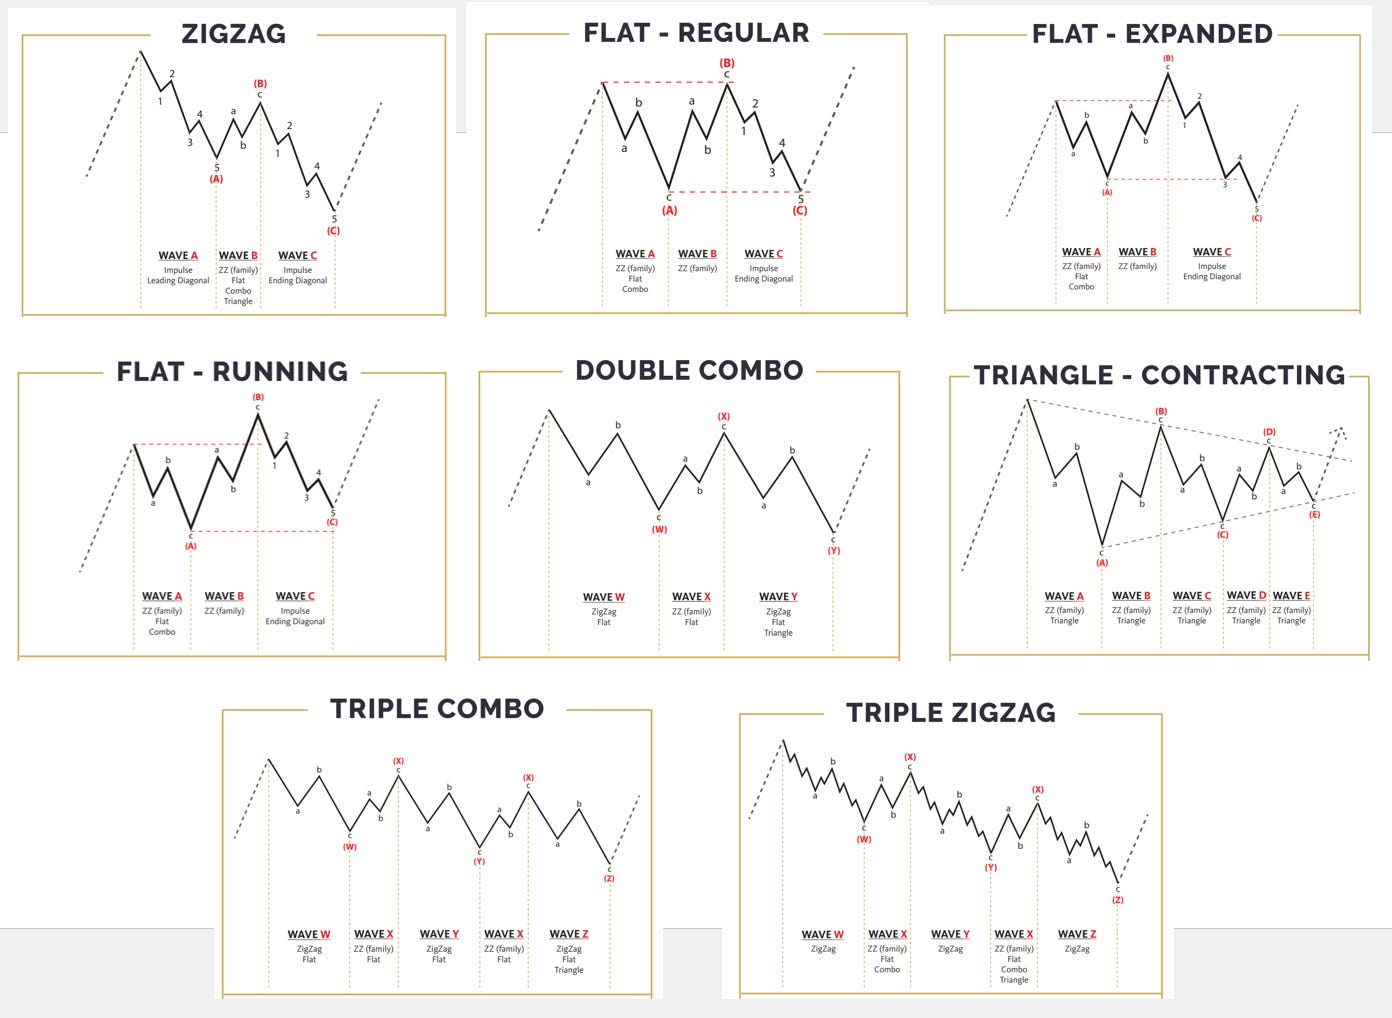
Now, given the number of different corrections available here, you can see how and why you are seeing very different counts coming from different elliotticians. Also note that Wave B/X in the corrections has gone up close to the top and in some cases even above that, but that doesn’t mean that it’s a new bull trend.
This is another point to understand, and if you have been a reader for quite some time, you have noted that I have never predicted a move to an all-time high. I have been reiterating the fact that we are in Wave B, we can be bullish above the breakout of 4180, and there are chances that we can do a double top as well. I hope this helps you understand why there is so much confusion all across the board and why even some traders have left trading and taken a pause.
Above was the technical aspect for the longer-term projections, and now let’s apply the same to the Daily time frame and see what we have. I am going to give you both what bulls are thinking and what bears are expecting
Bulls Theory
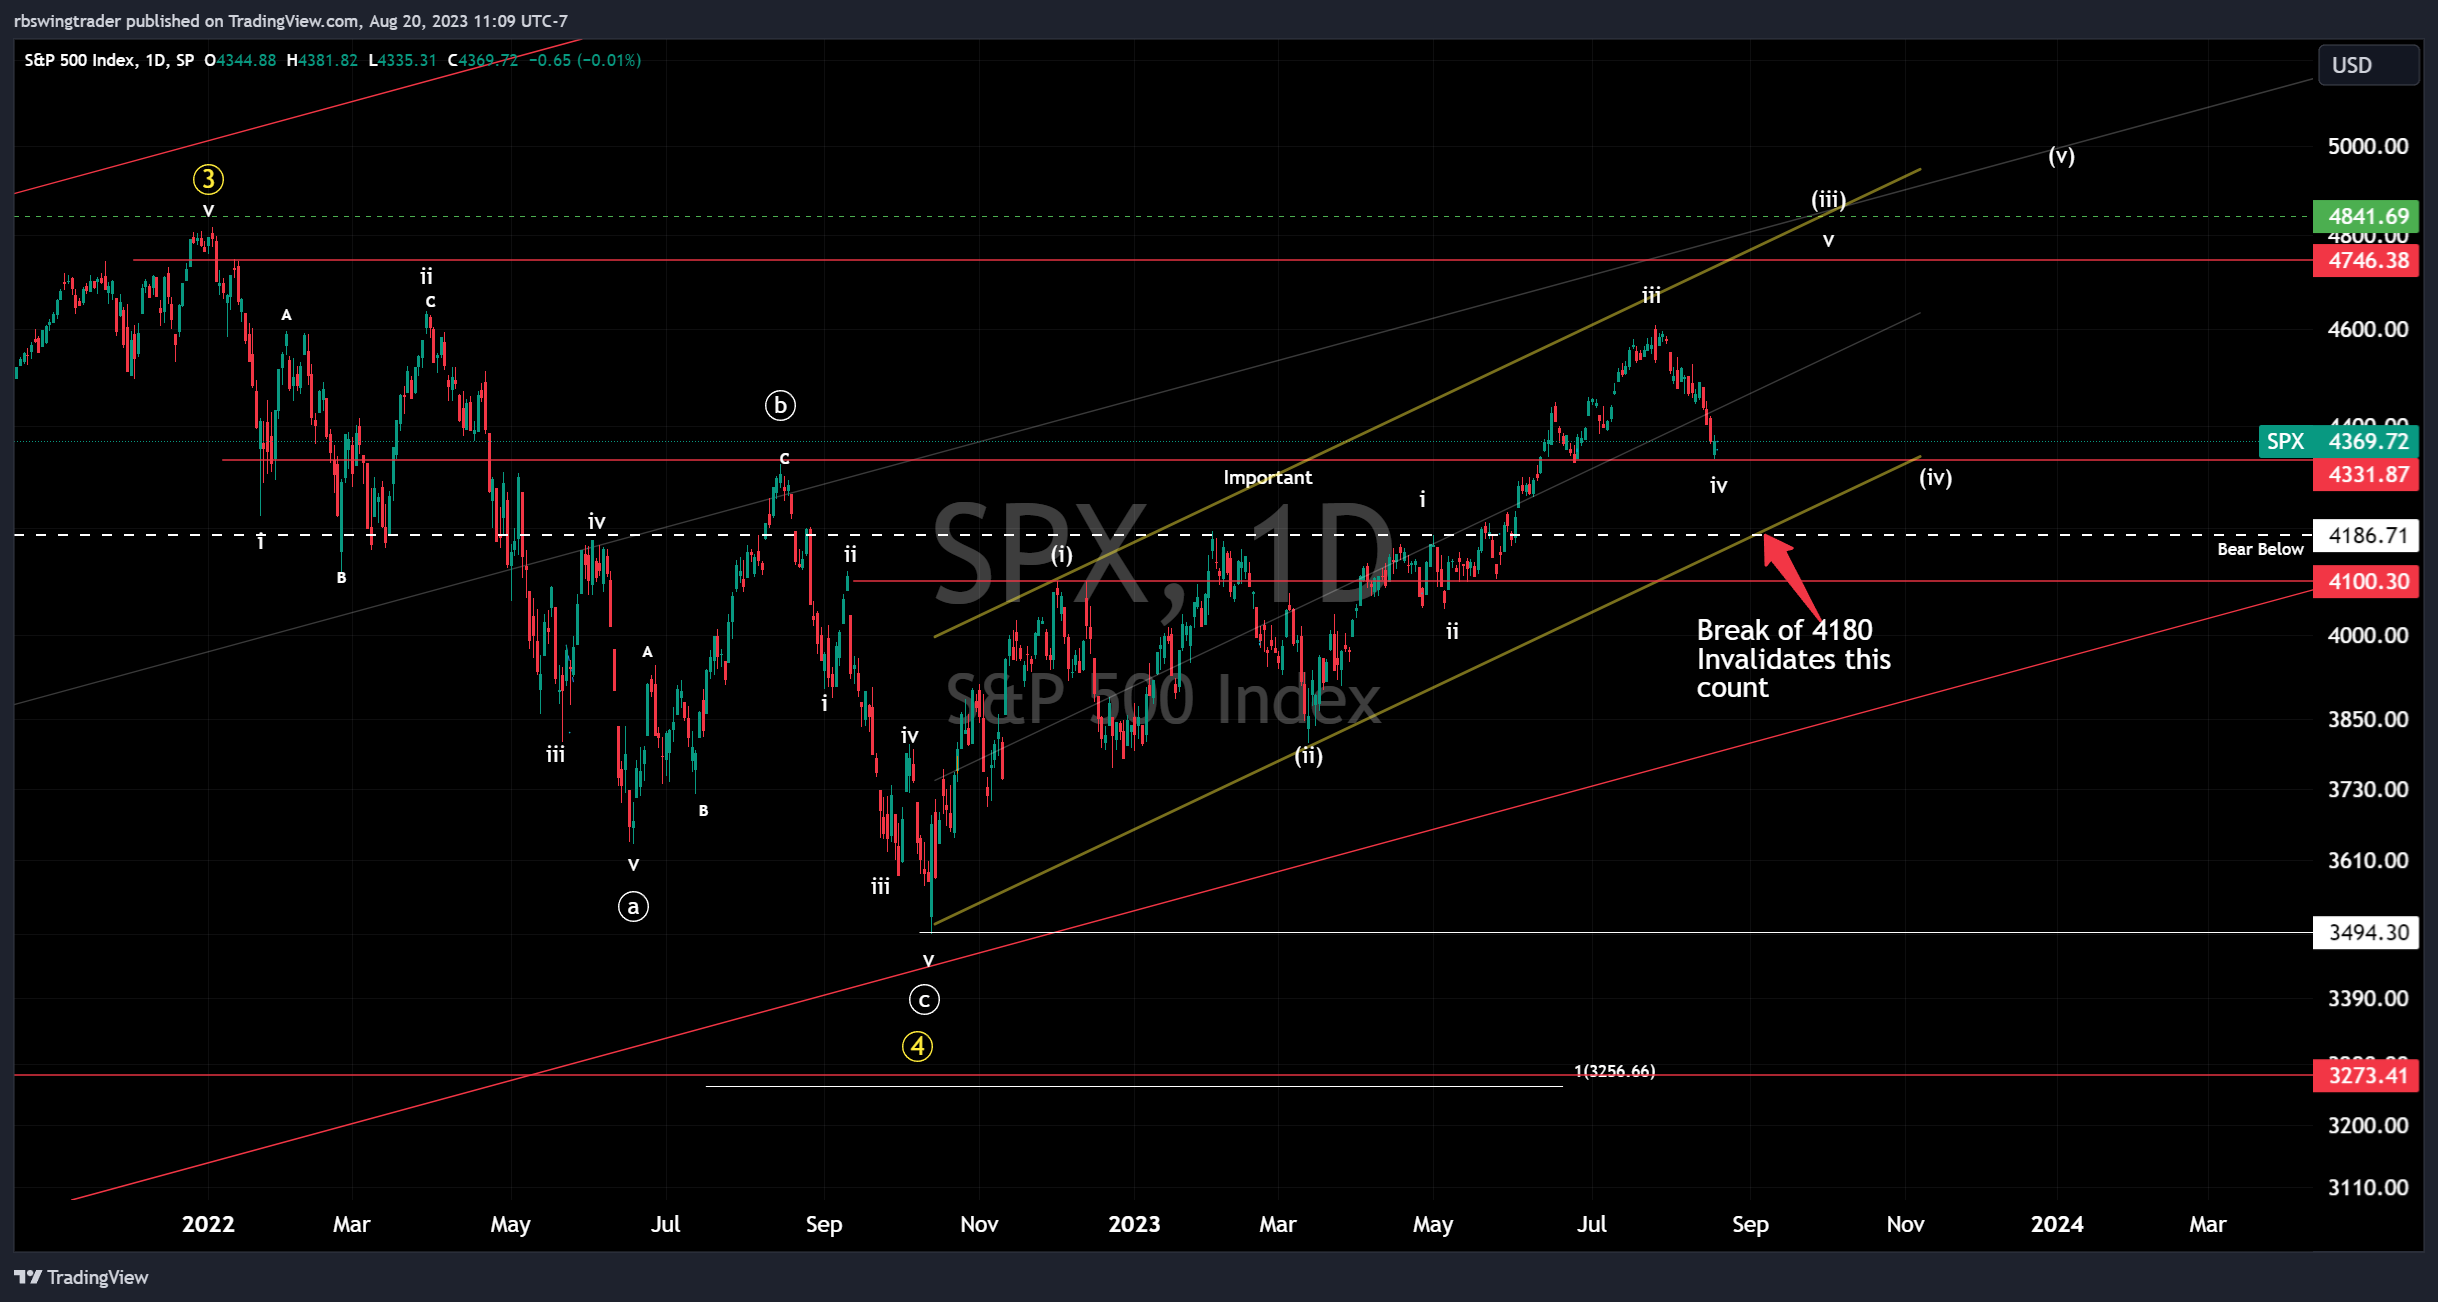
Like I shared above, bulls think that Wave 4 was over at 3500, and they are now in the first wave towards 6000. There are two ways they are counting it, and below I am going to share where these theses will be invalidated. Let me remind you this bull count doesn’t terminate at 5000 but this is just wave 1 for the bulls.
Chart 1
and some are counting this as the below; there are minor differences in the nesting of 1-2 waves.
Chart 2
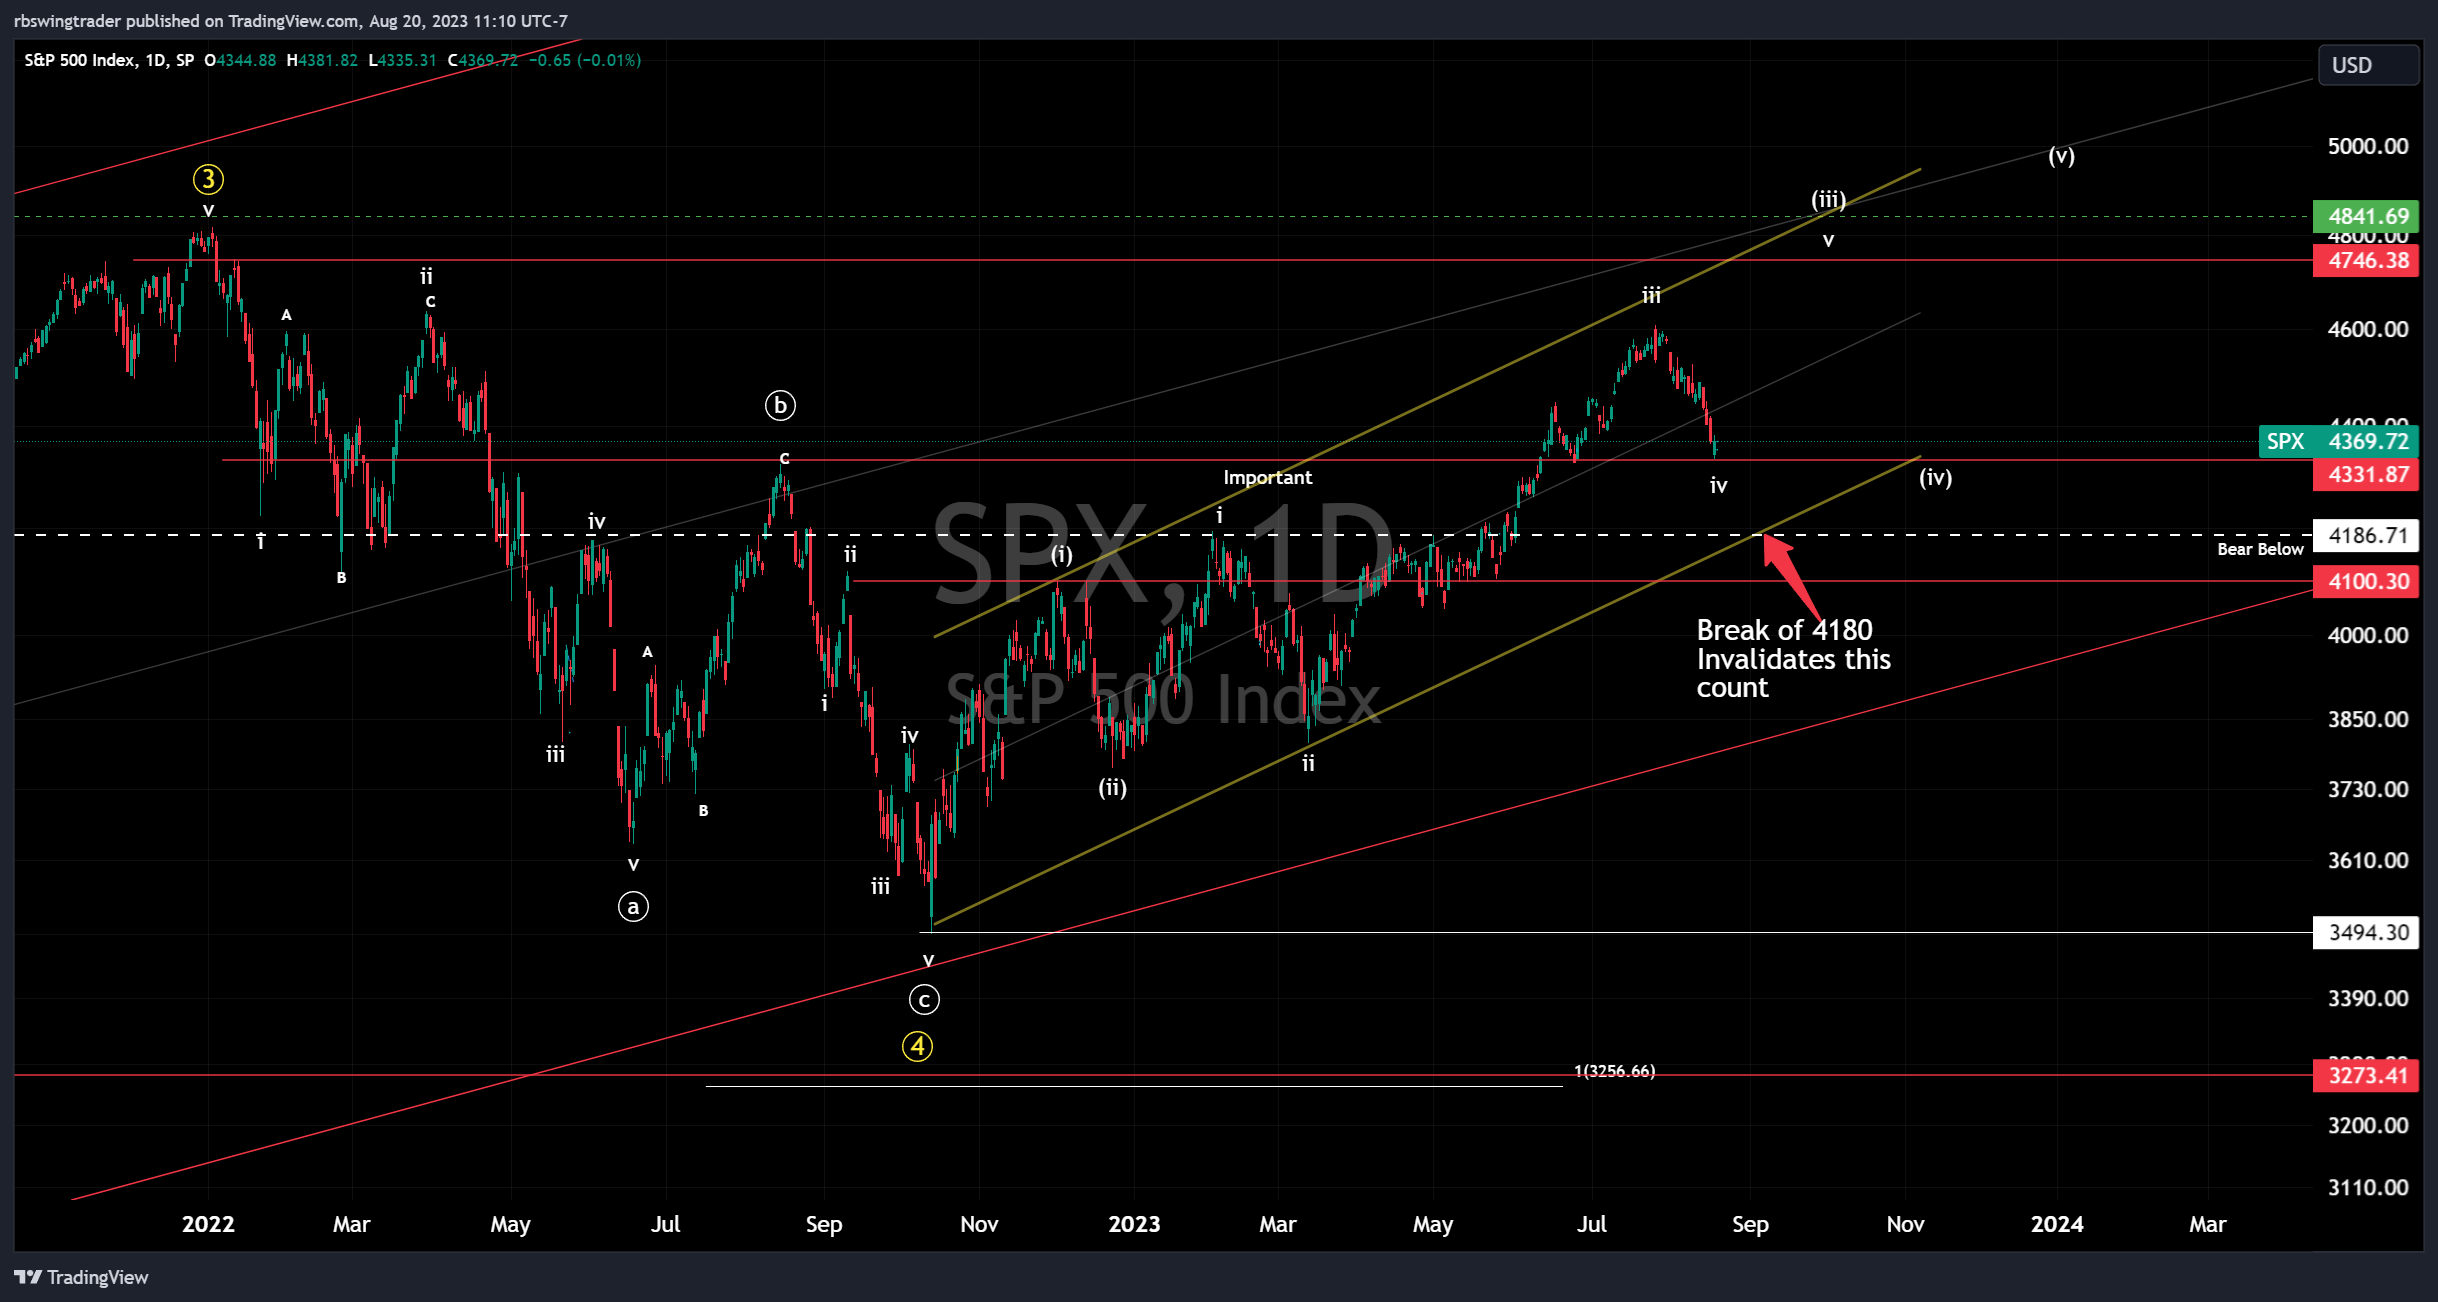
But the common point of invalidation is 4180. Once we break 4180, it will be clear these bulls counts are not valid, and the move that took the index to 4607 was in fact Wave B and X of a complex Wave 4.
From the above chart, you can also see why I have been calling 4325 important for bulls, as that's a good retracement level for the small “IV” pullback of bulls, but if the price starts dropping below that, bull confidence will start taking a hit.
Bears Theory
Bears as well have two counts, as below, and again, the same levels play an important role in that.
The first one is that 4607 was “The Top”. In this case, it’s important that next week we start taking out 4325 as the first step and complete a 5-wave structure, which I shared in Thursday’s post and will be detailed again in the trade plan.
Chart 3
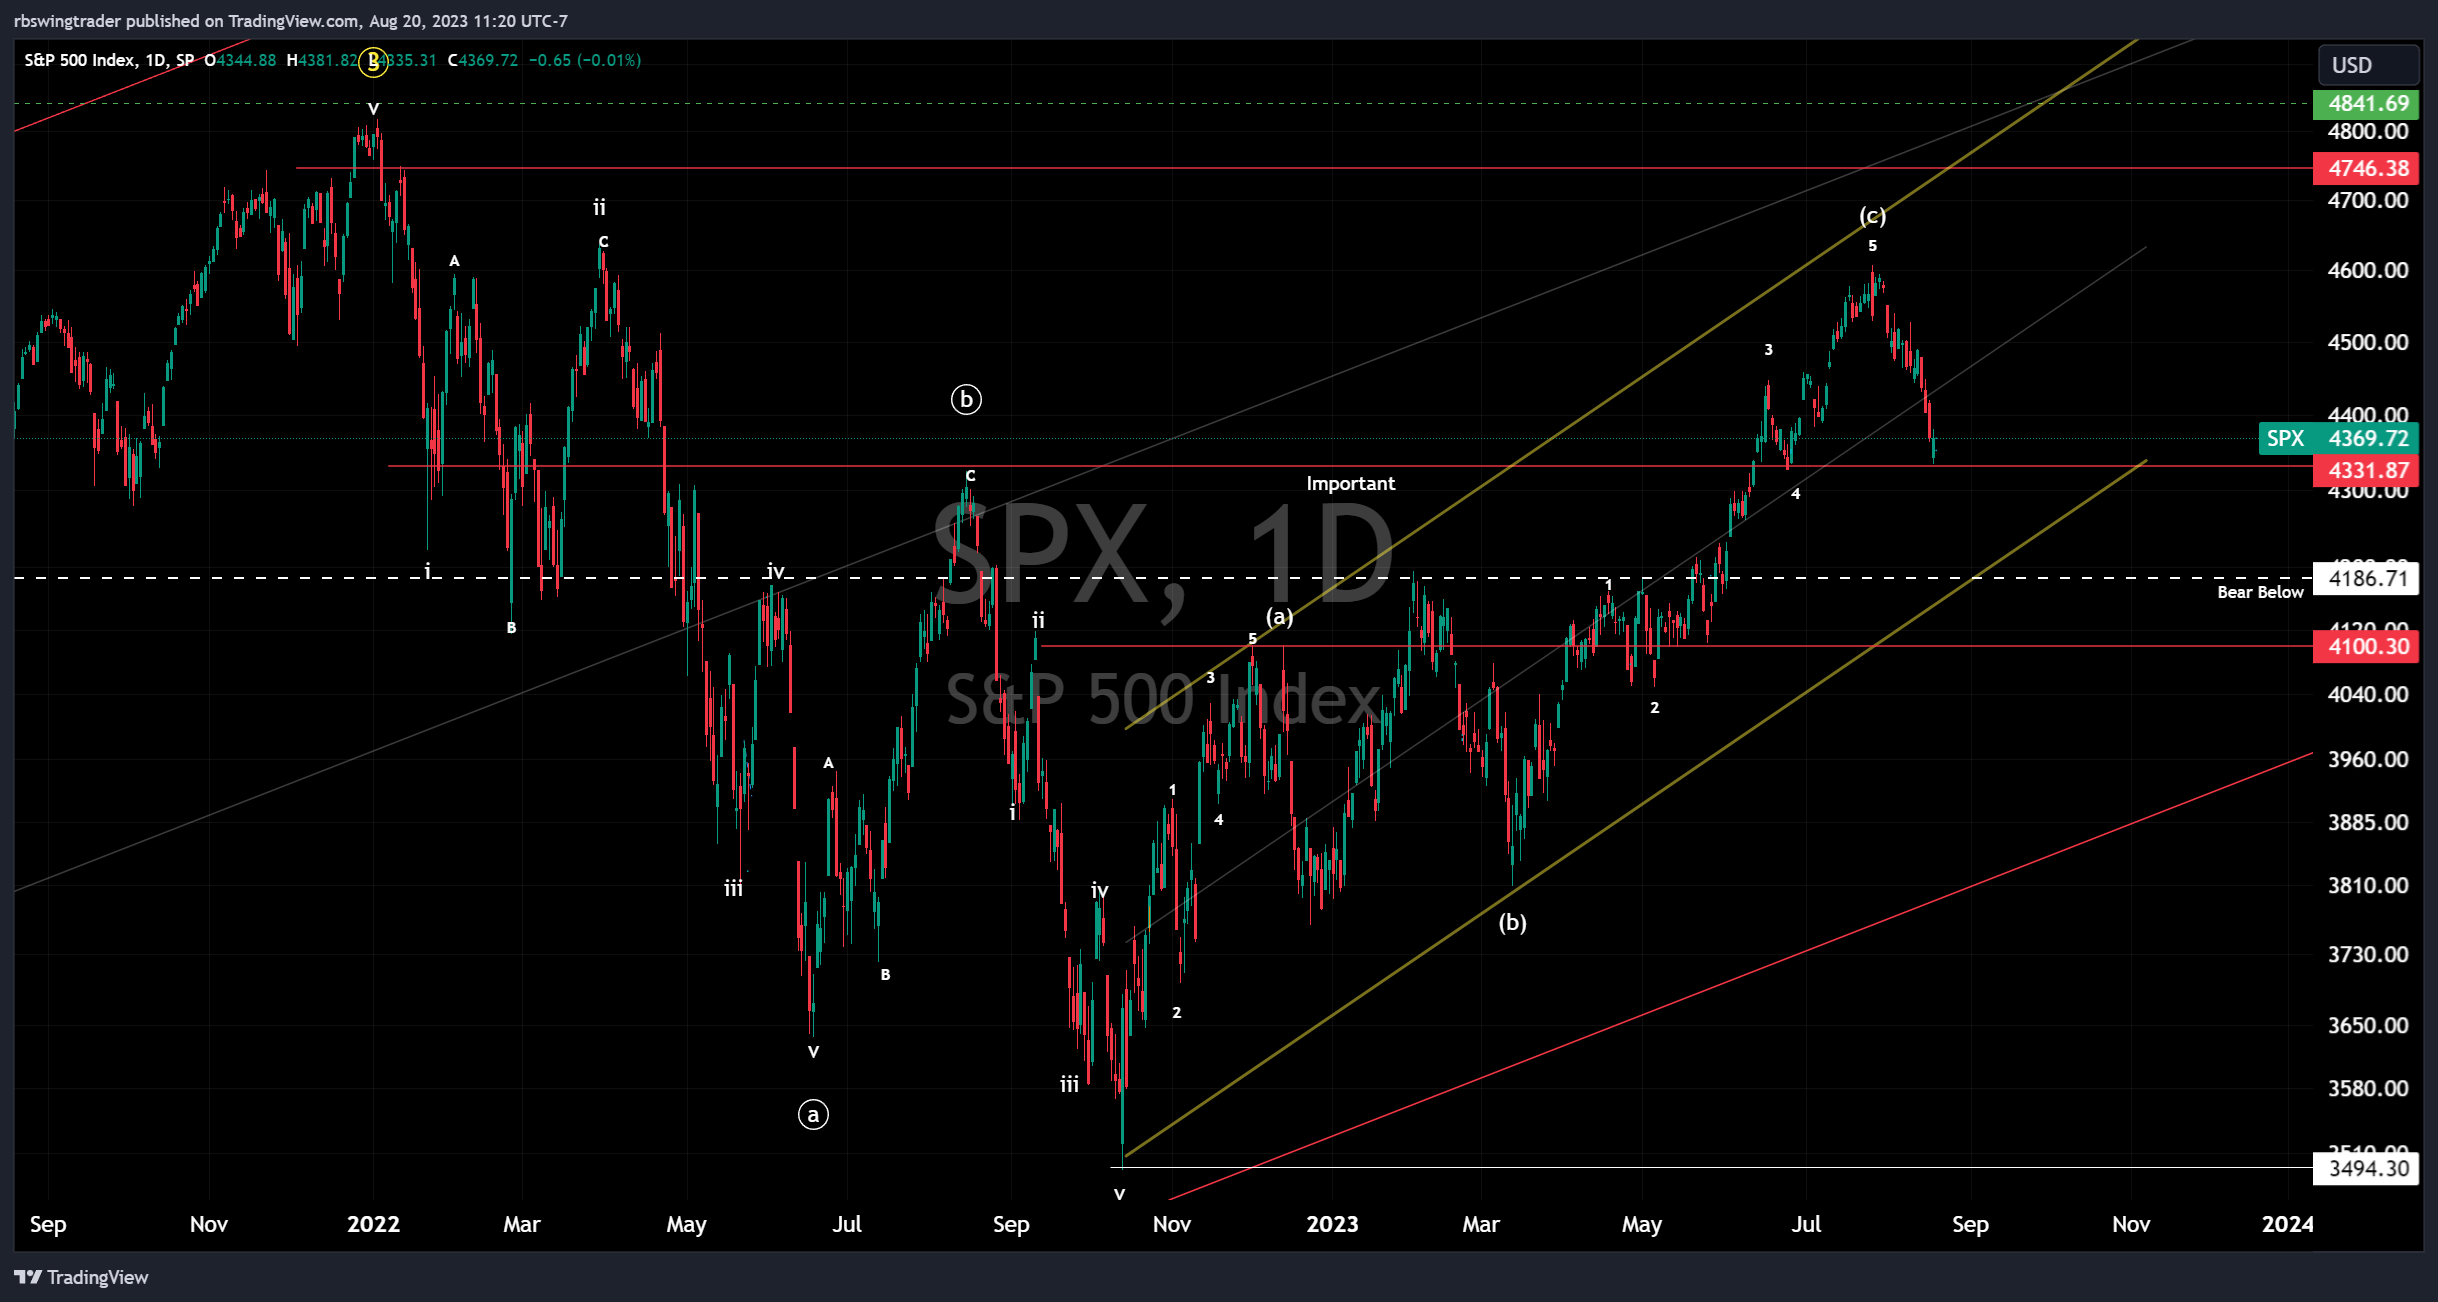
The second theory is that there is one more move up to the double top before the bulls punch out completely on this Wave B-up. In this case, 4325 will not be breached in the coming weeks, and If 4325 holds next week and we start going above 4450, then most likely we will see 4670 as well.
Chart 4
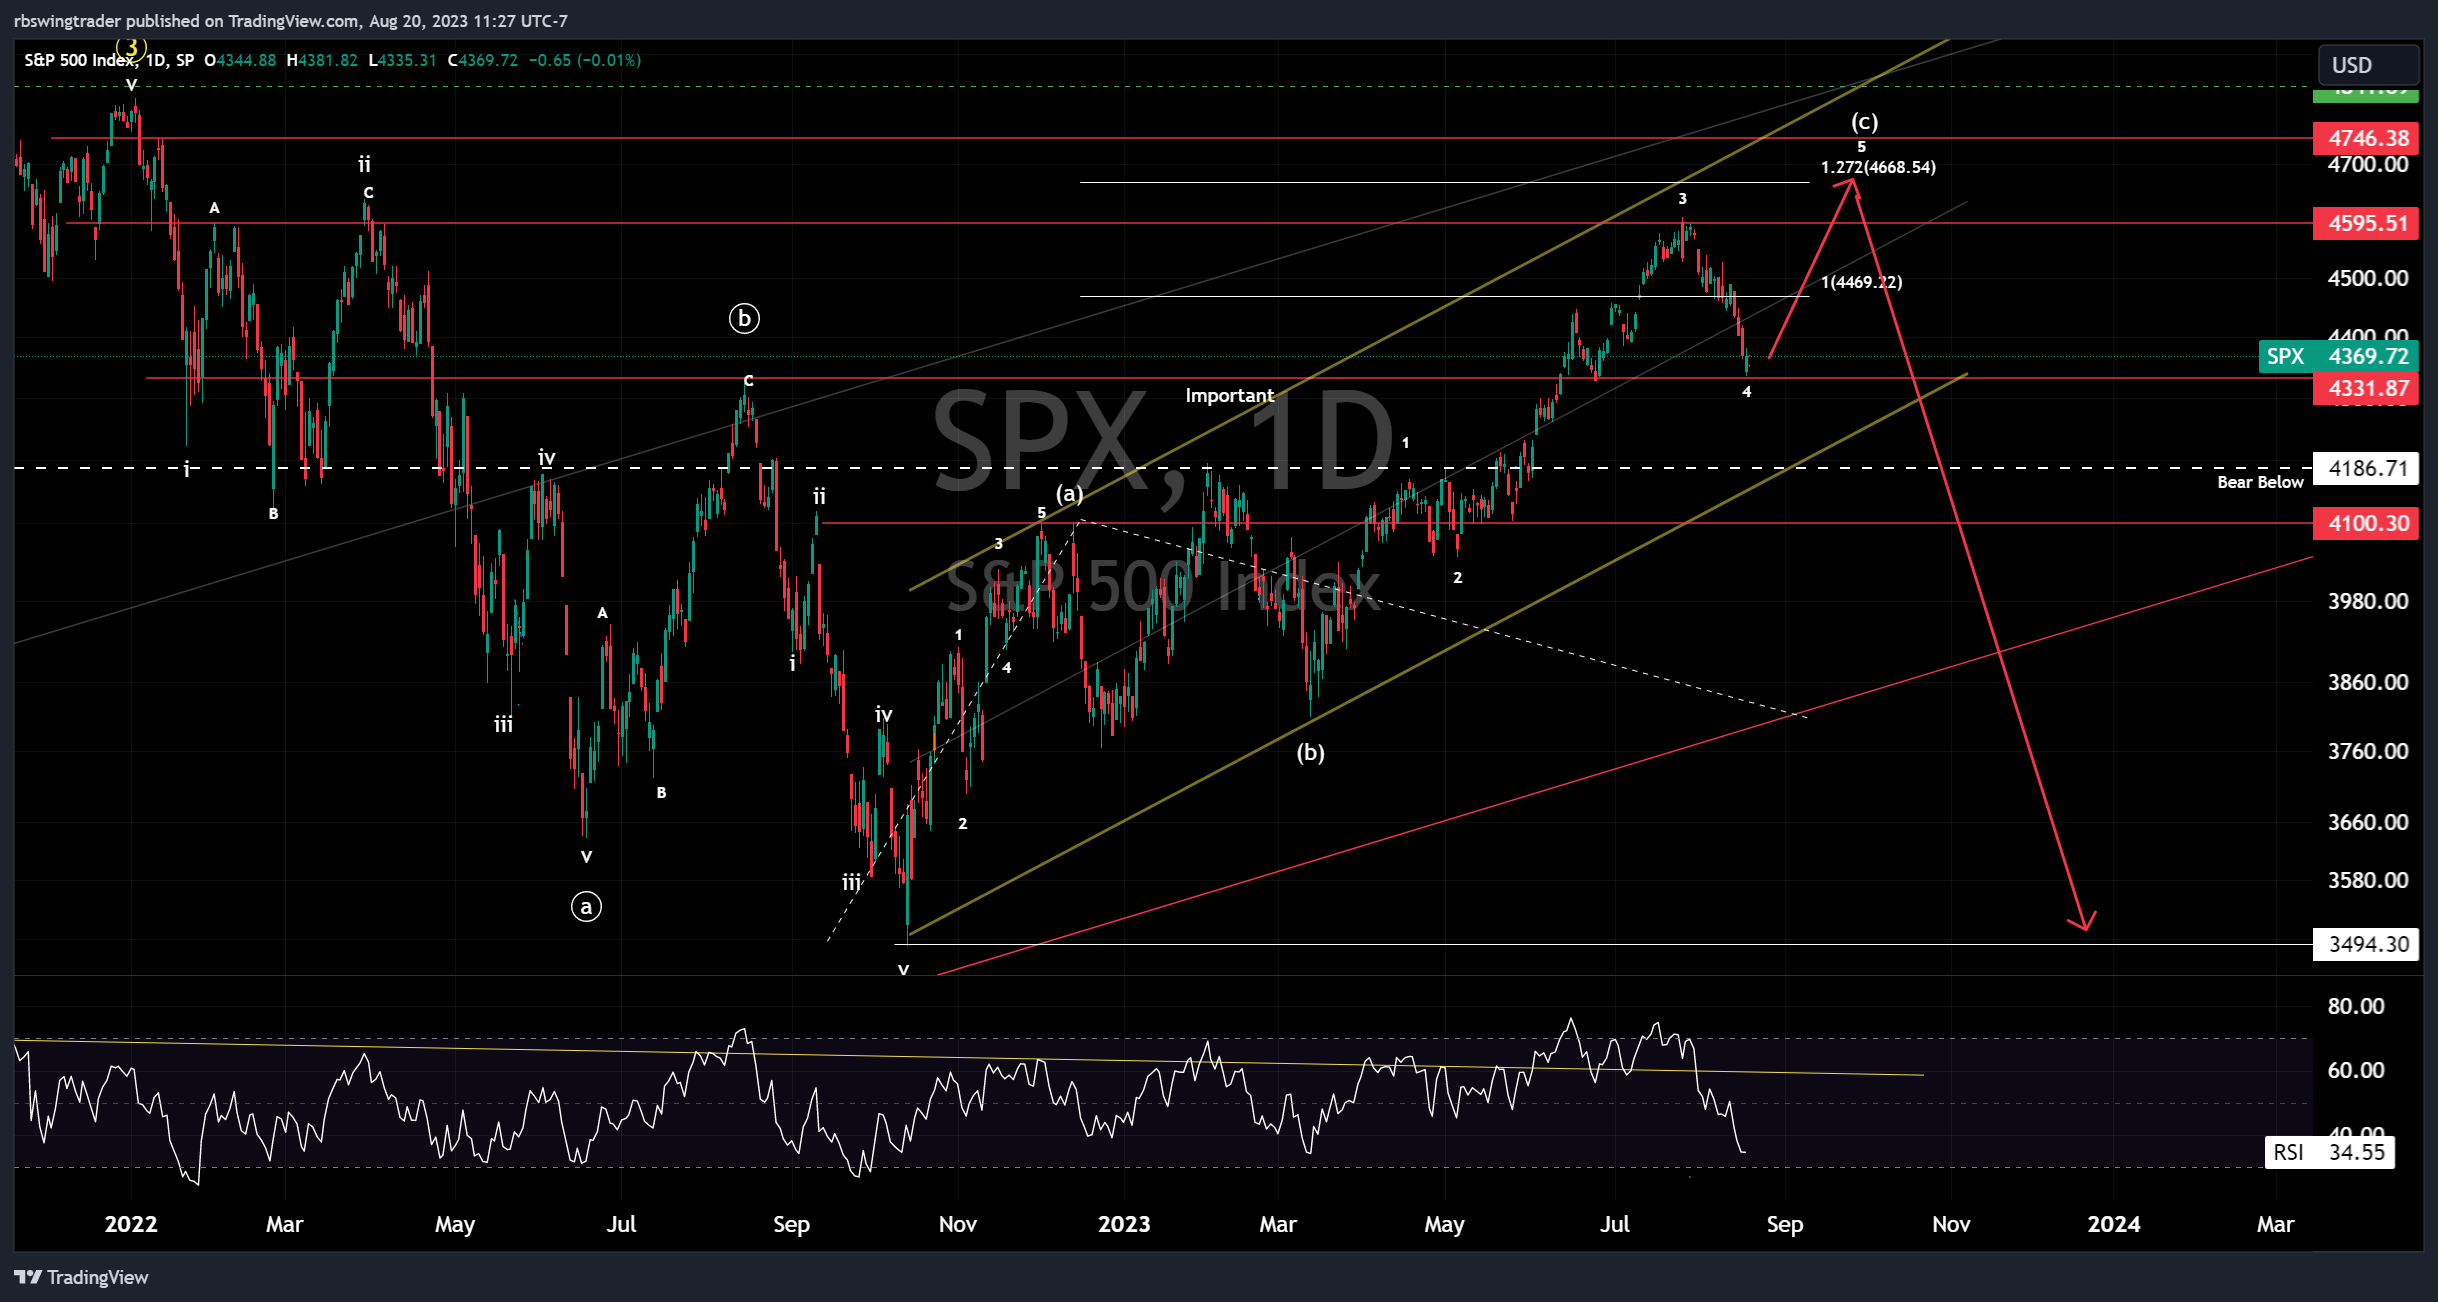
The point to note in the above 4 charts is that there are 3 charts that have upside (Chart 1,2 and 4), including two from bulls(Chart 1,2) and one from bears (Chart 4), where the top is 4670. In the trade plan today, I will talk about how to validate and invalidate the only bearish chart from above, as if that gets invalidated, then we know that there is still one more move up, at least to 4670. If that gets validated, it will invalidate the rest of the three upmove charts. Hope you are following me, if not, please read again.
This was a lot of technical detail and complexity about Elliott waves, and I recommend saving these charts and this post as this is going to be a reference point for the next few weeks. Read it a few times if you need to, and ask any questions you have. I might share this as a blog on my website https://rbanalytics.net to keep as a reference in future posts.
I hope this has also given you clarity about why 4325 has been my pivot point and how, below 4180, any bull theory that exists today will cease.
If you are not a scalper, which I am not, I recommend you evaluate these paths before taking any big positions.
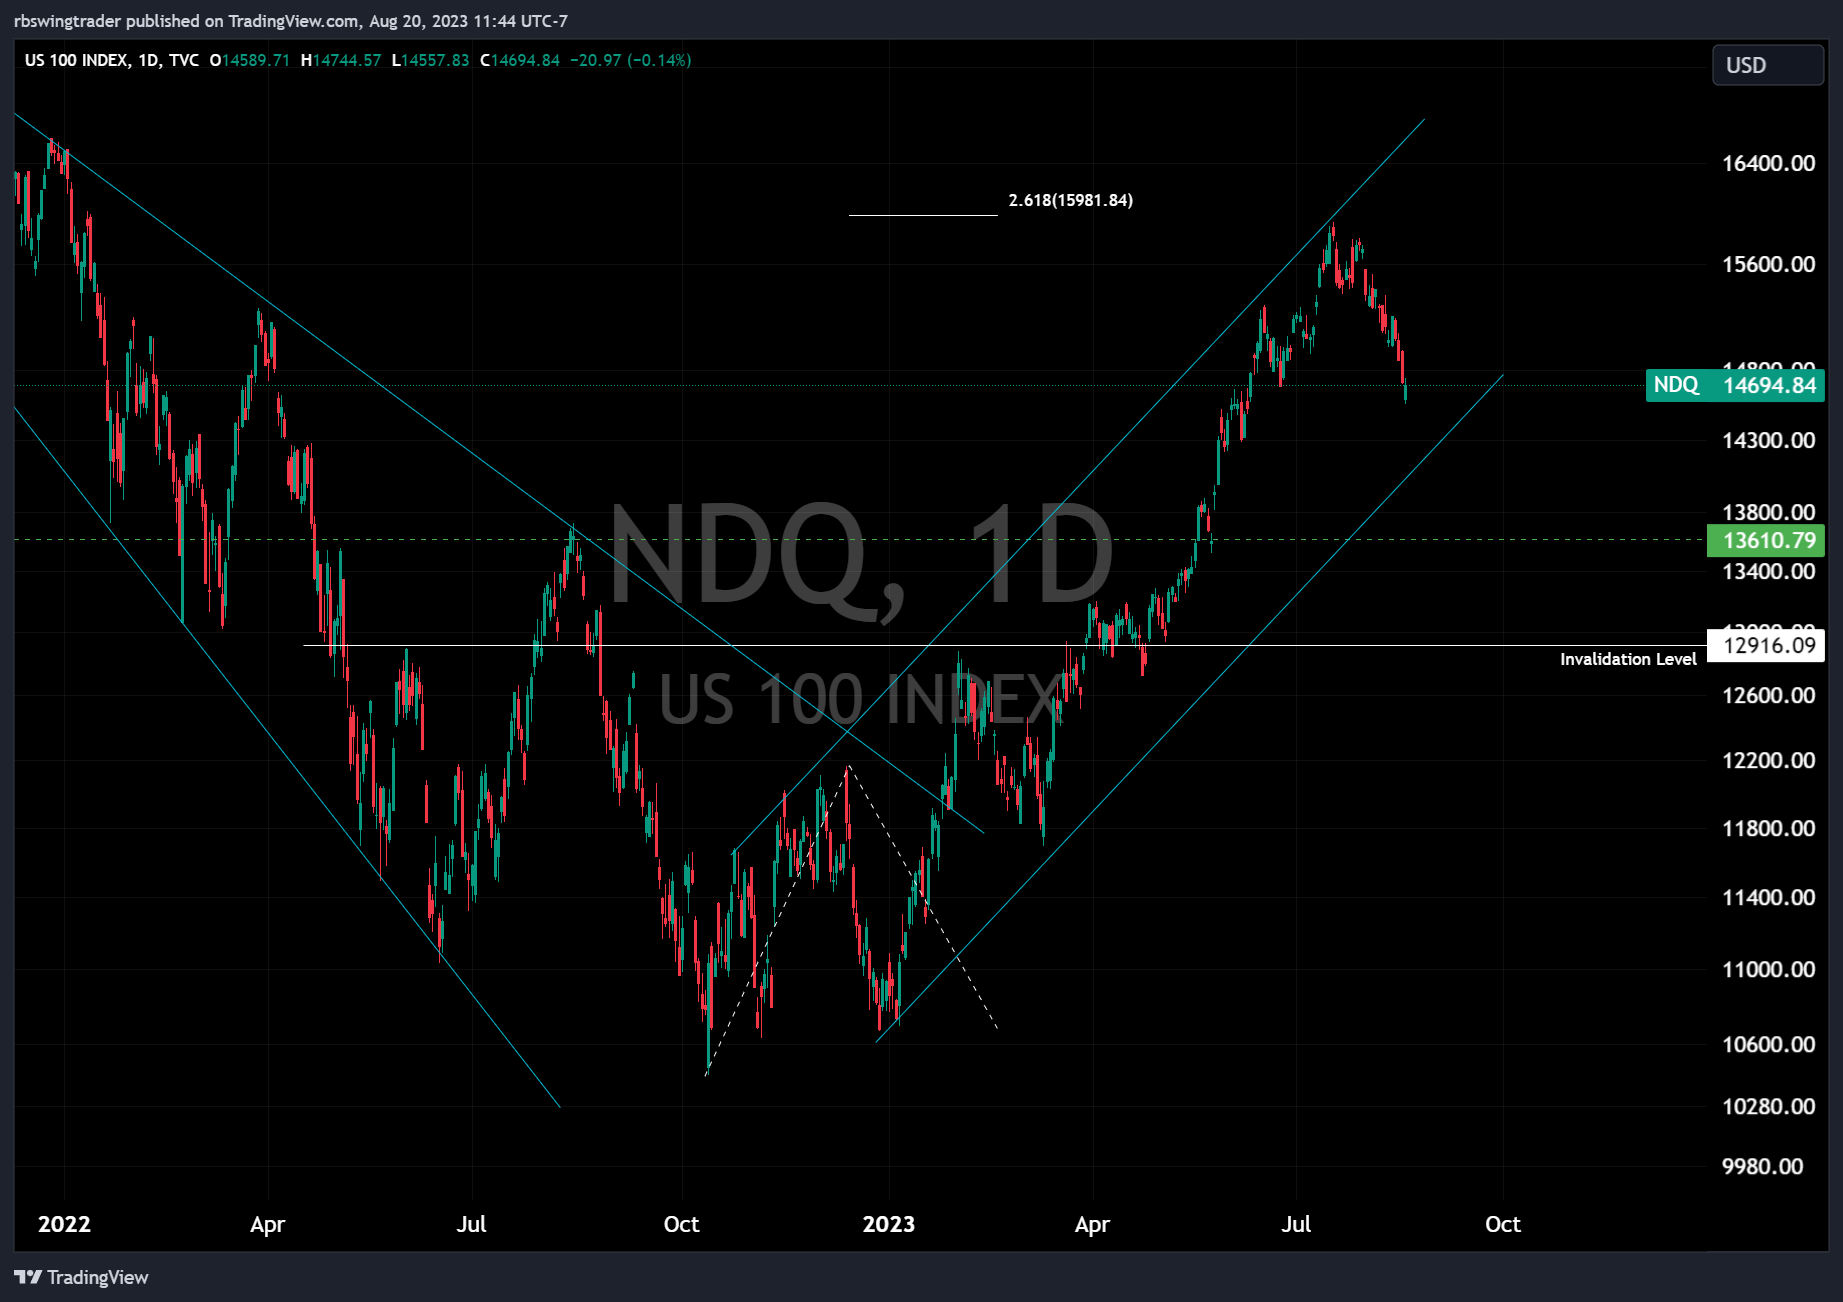
Now, the above was just about SPX, but other indices have different structures, such as NDQ, which actually broke out much higher and whose invalidation level, according to bulls theory, will only happen when it breaks 13000, or the IWM, which never had any breakout or a bull count but a sideways consolidation.
NDQ
IWM
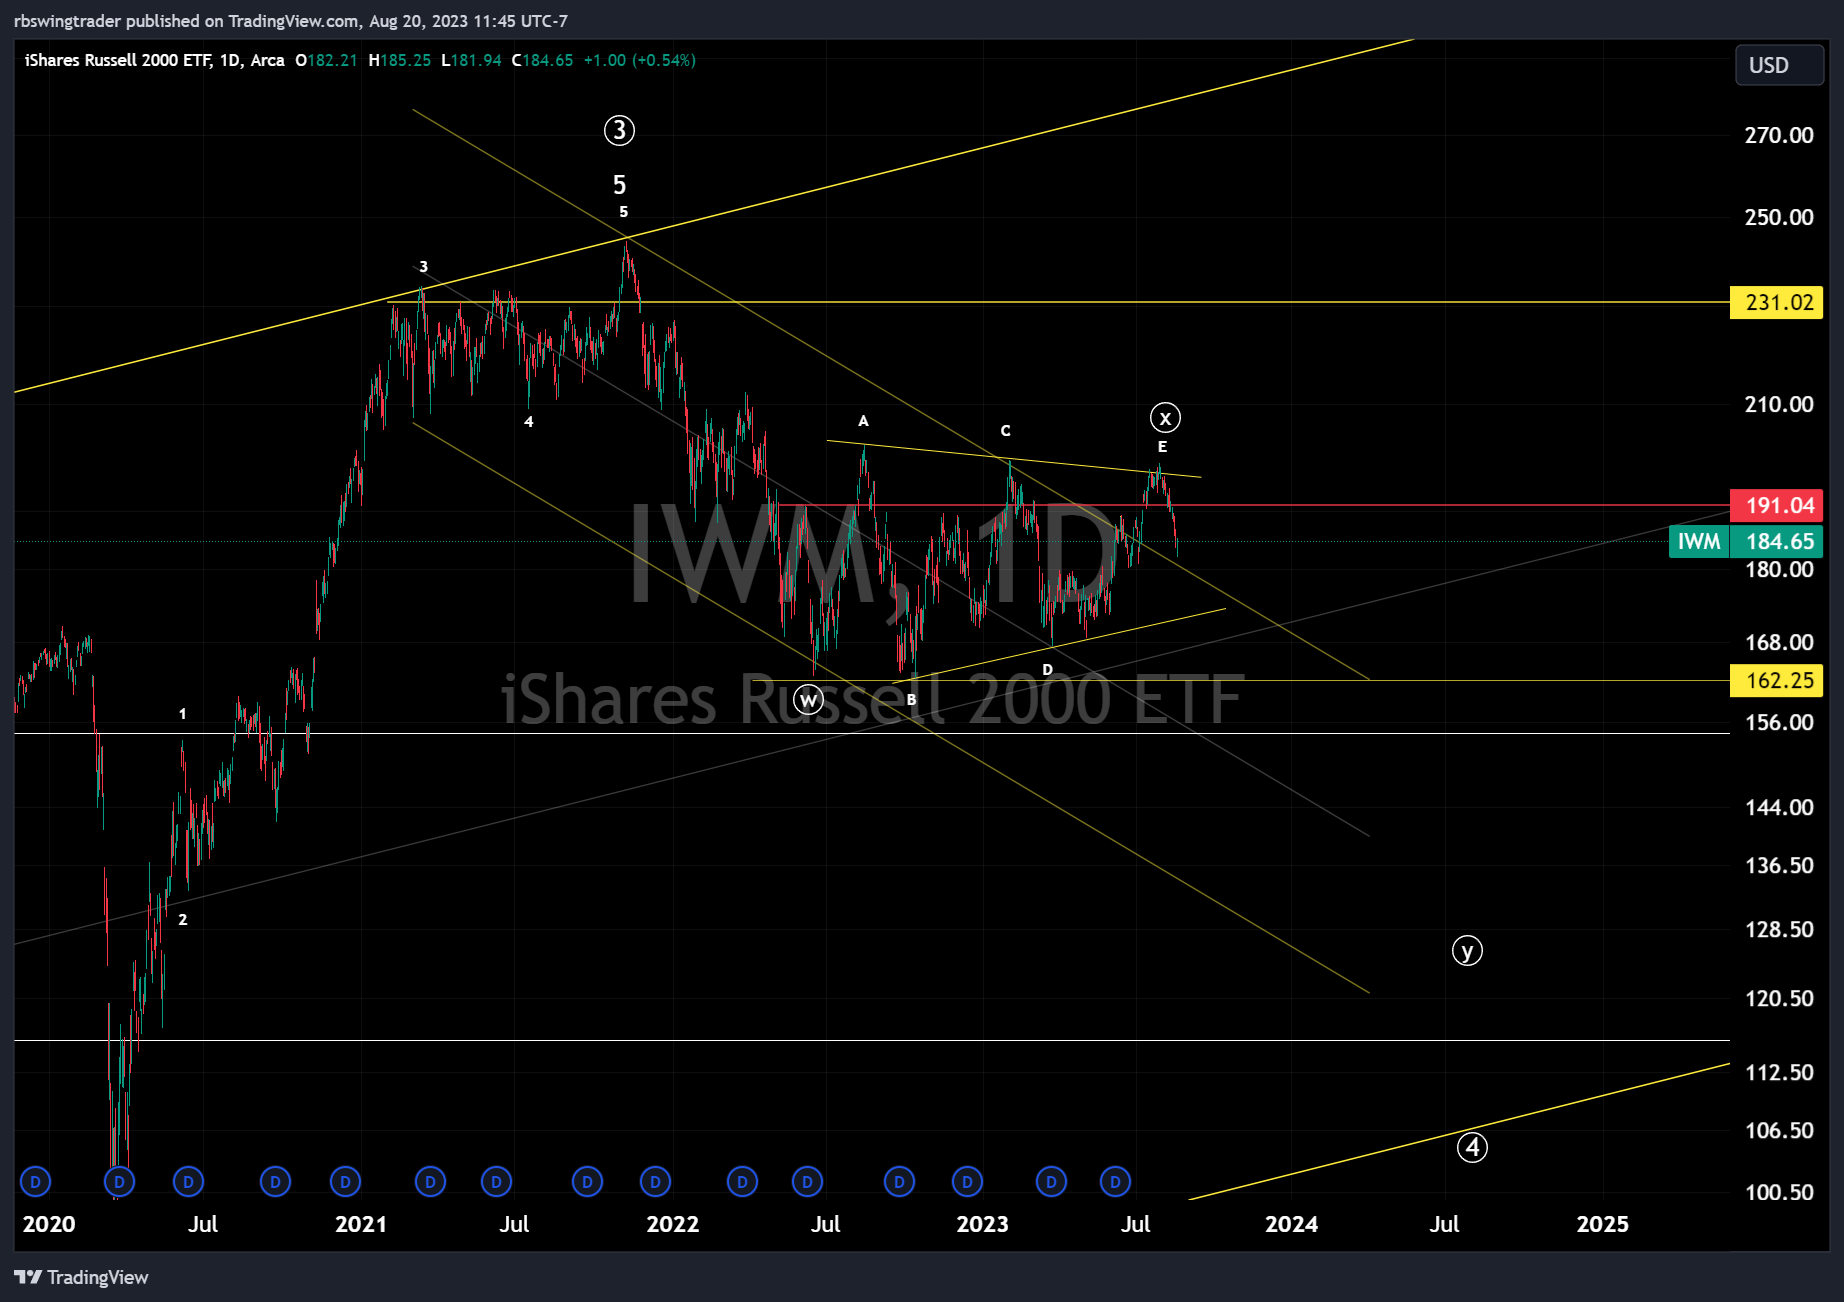
IMO, this is going to get more clarity in the coming days. Let’s see what happens at Jackson Hole and whether 4325 holds, and we can pin down the direction to at least trade safely for the next 4-5 months.
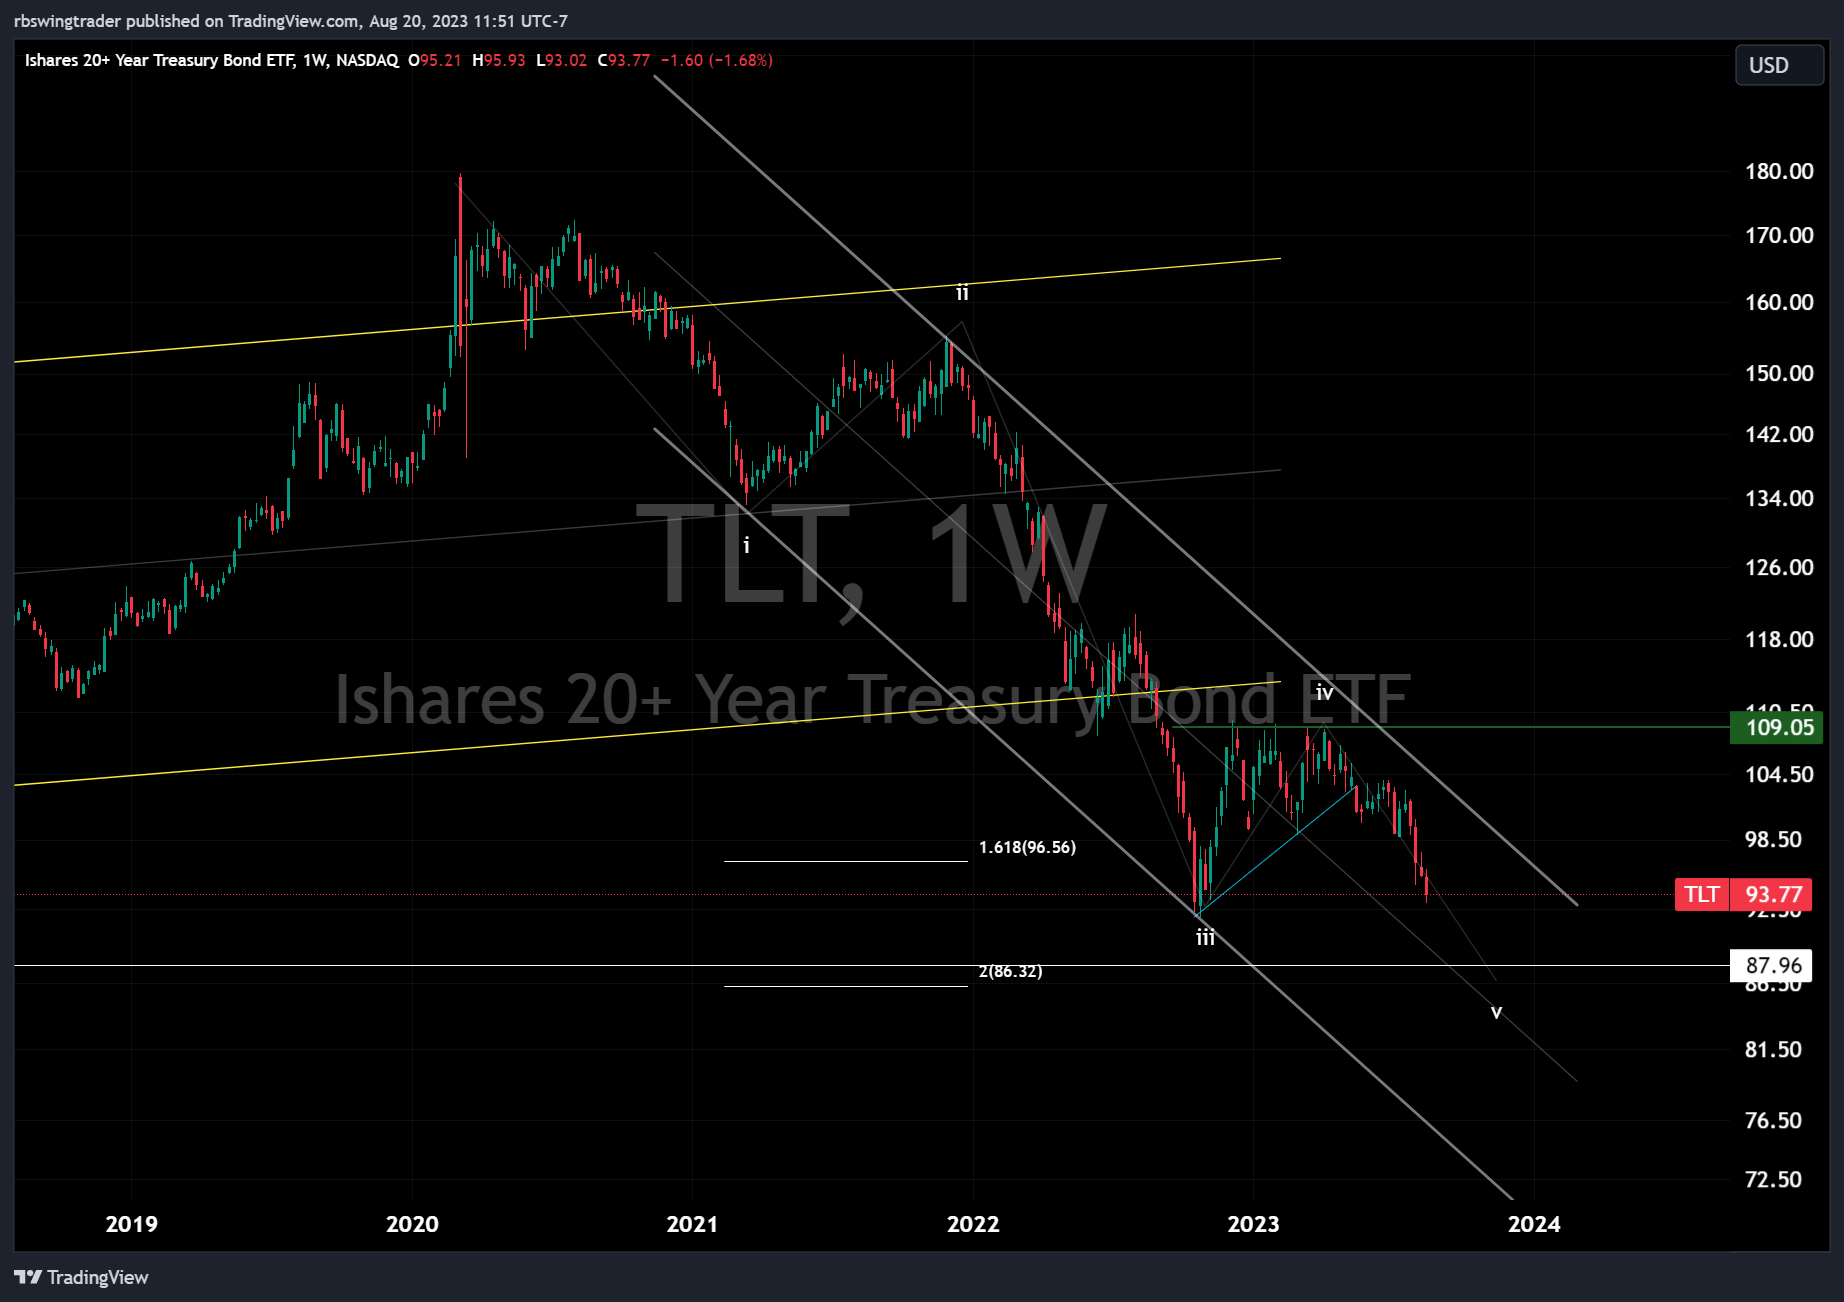
While we are on these long-term charts, let’s just have a look at the bonds that are still selling off and the yields that continue to grow.
Bonds bottomed around the same time, along with indices, in October, but the bounce was shallow, and now we are heading back down in Wave 5, and I think it will drop to 87 before this move is over.
and the yields will top close to 5.00
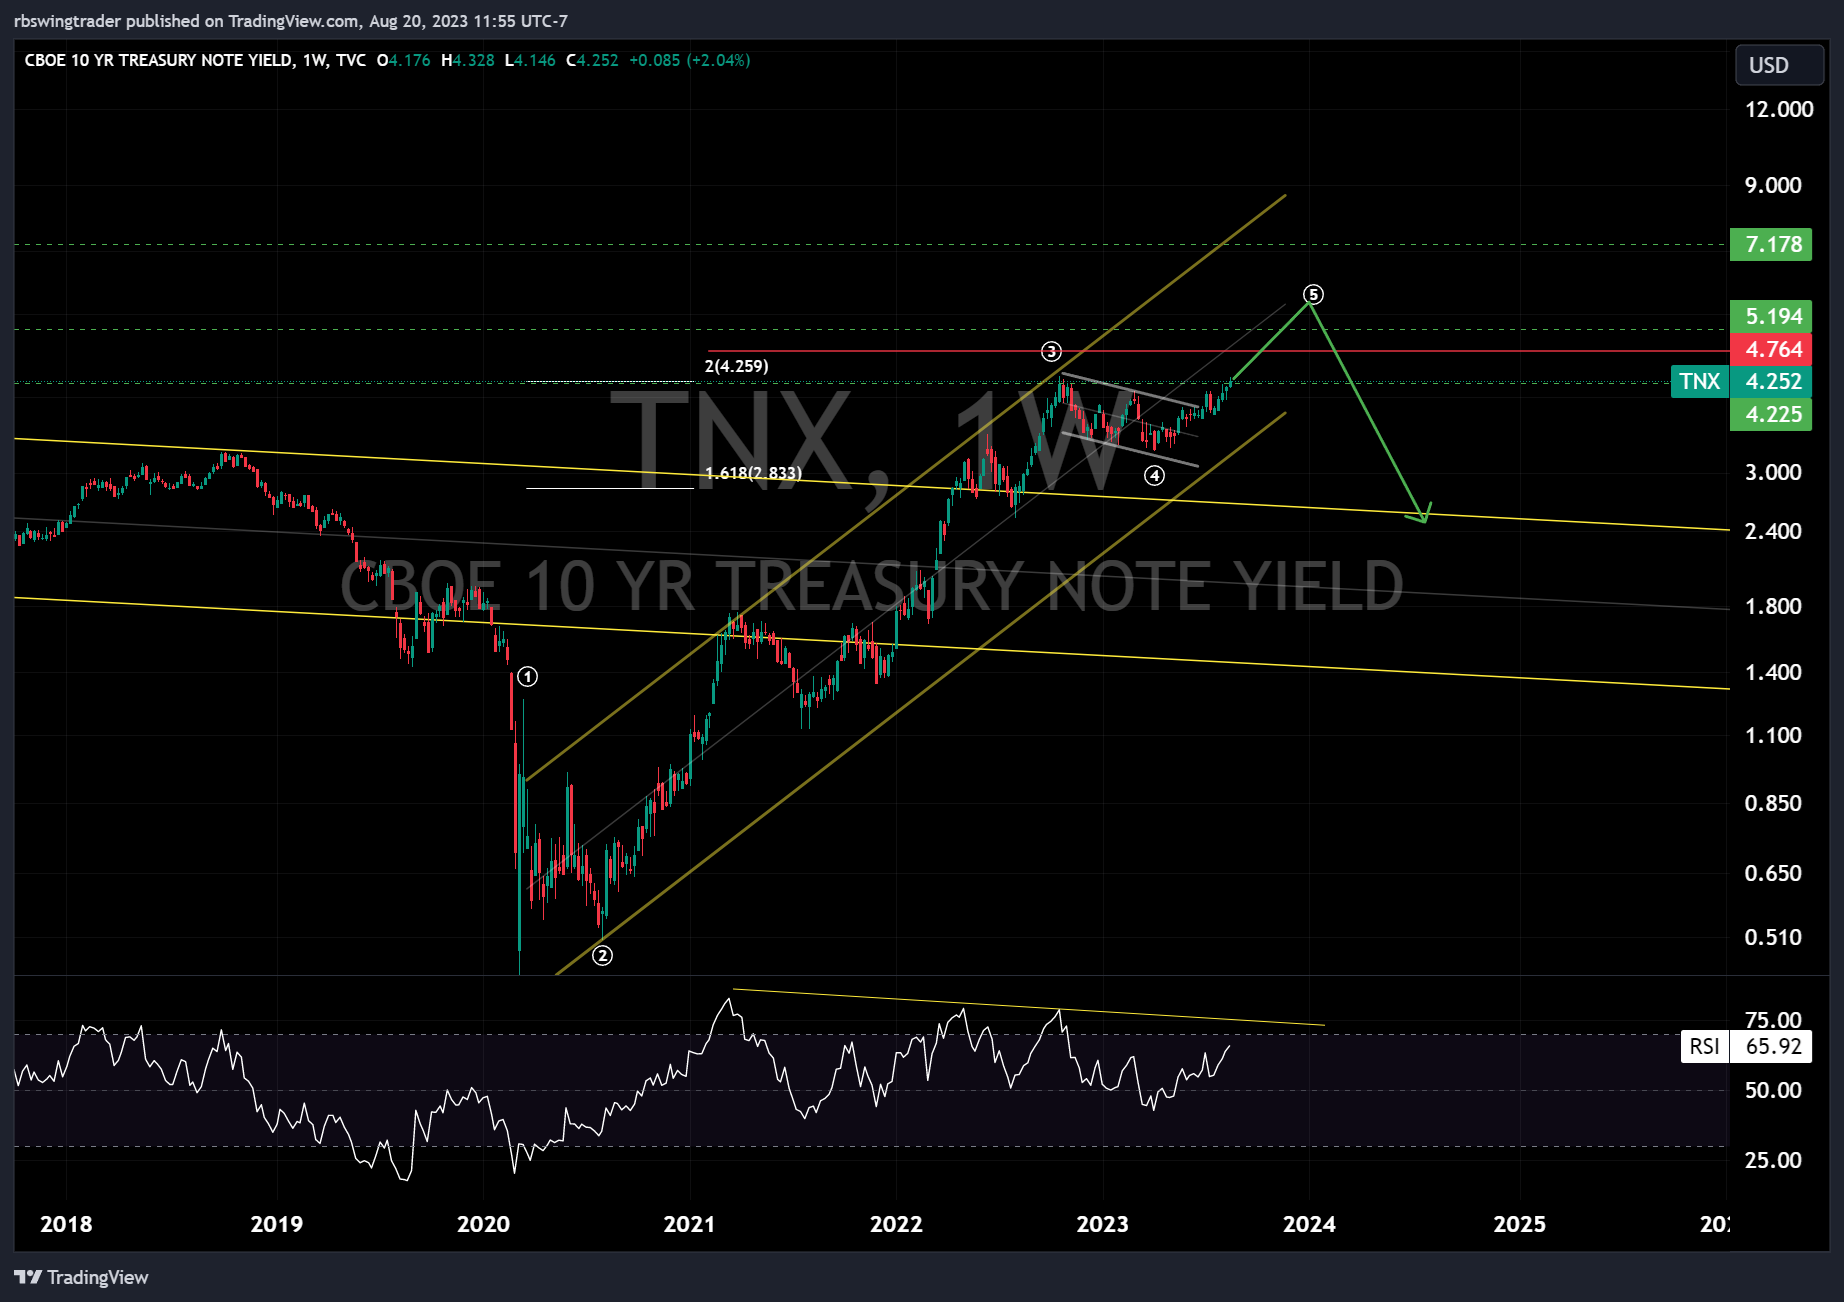
What would this mean? I am not into the bond markets, but my sense is that long-term investors would want to tap into the highest yields of the last 10 years, and that can cause a temporary rotation from equities for the coming time, giving bears the last drop they are looking for.
If you look at the comparison chart of the bond market and SPX, they cannot be related on a week-to-week basis, but at least since COVID bonds have been in a downtrend while indices have not corrected.
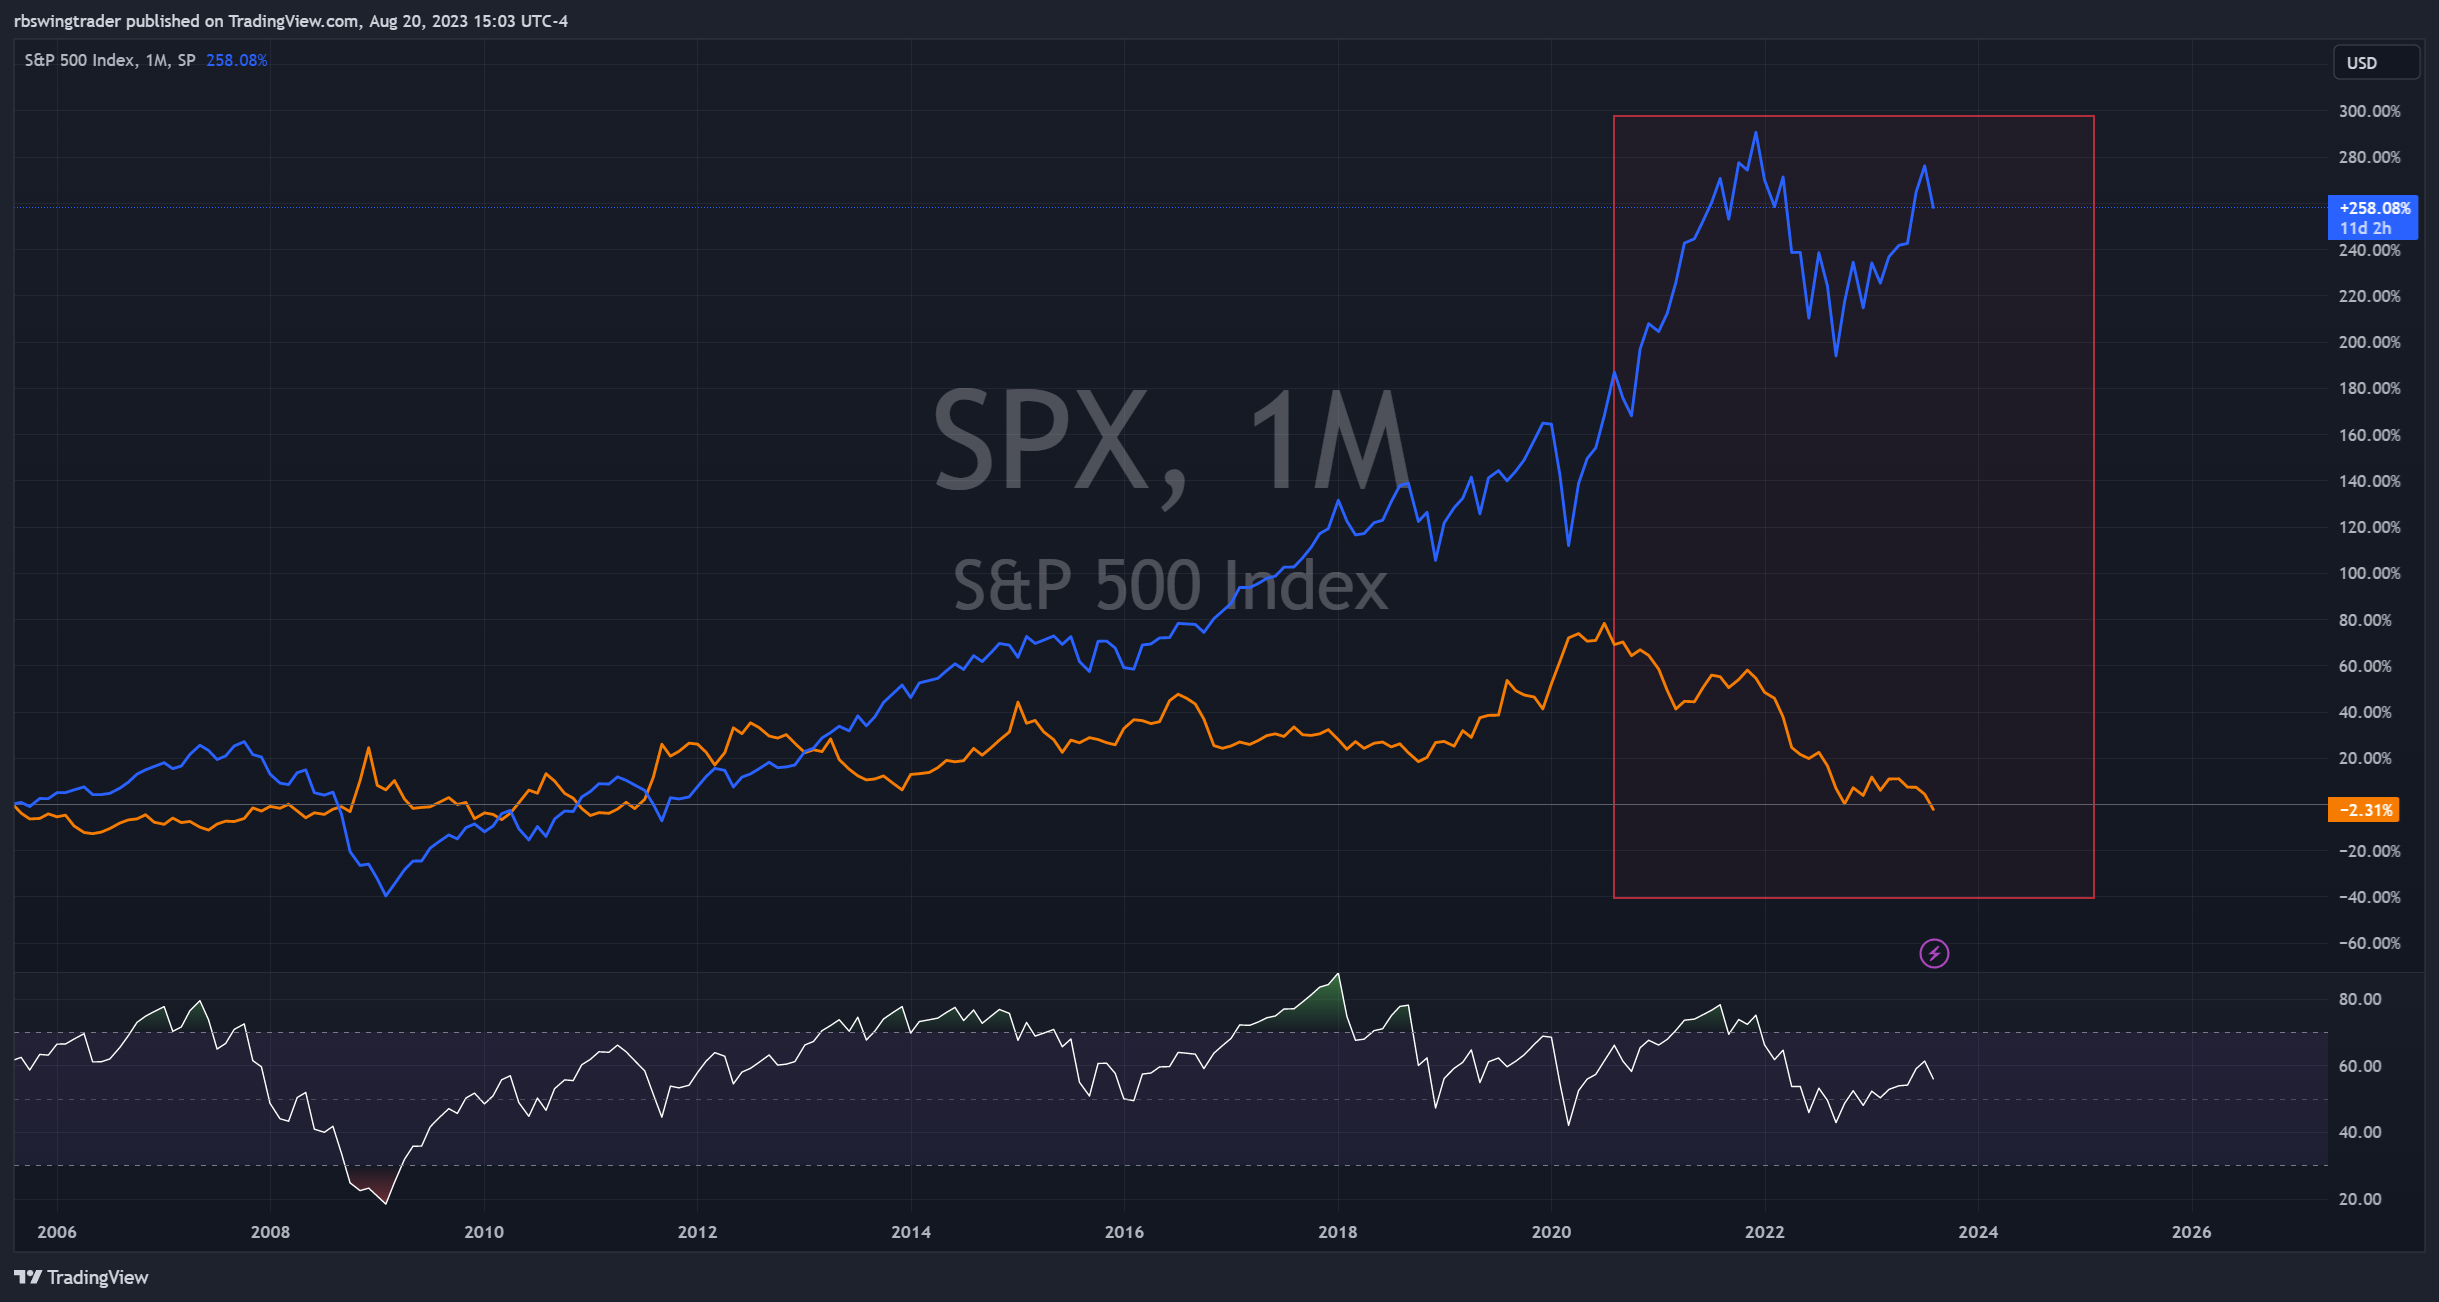
There are always many factors in these complex markets, and this is just my view based on what I can see from the charts.
Now that we know the levels and what’s going on in the markets, let’s talk about the trade plan for next week.
Trade Plan
SPX: Now that we know the bulls and bears theories and our key levels of 4325 and 4180, let’s look into what a break of 4325 looks like as well as, if it holds, what it can be. As you read above, the intent is to validate or invalidate just one long-term chart out of the four, and then we can build positions based on that.
So far, the drop has been impulsive. Now if you just try to make a difference between the Impulse count and the Zig Zag correction from the below images, you will see that the creation of waves 4 and 5 is the biggest difference. Another difference is that in Zig Zag, either C = A or C = 127% of A, but in an impulse, leg 3 is at least 161% of 1.
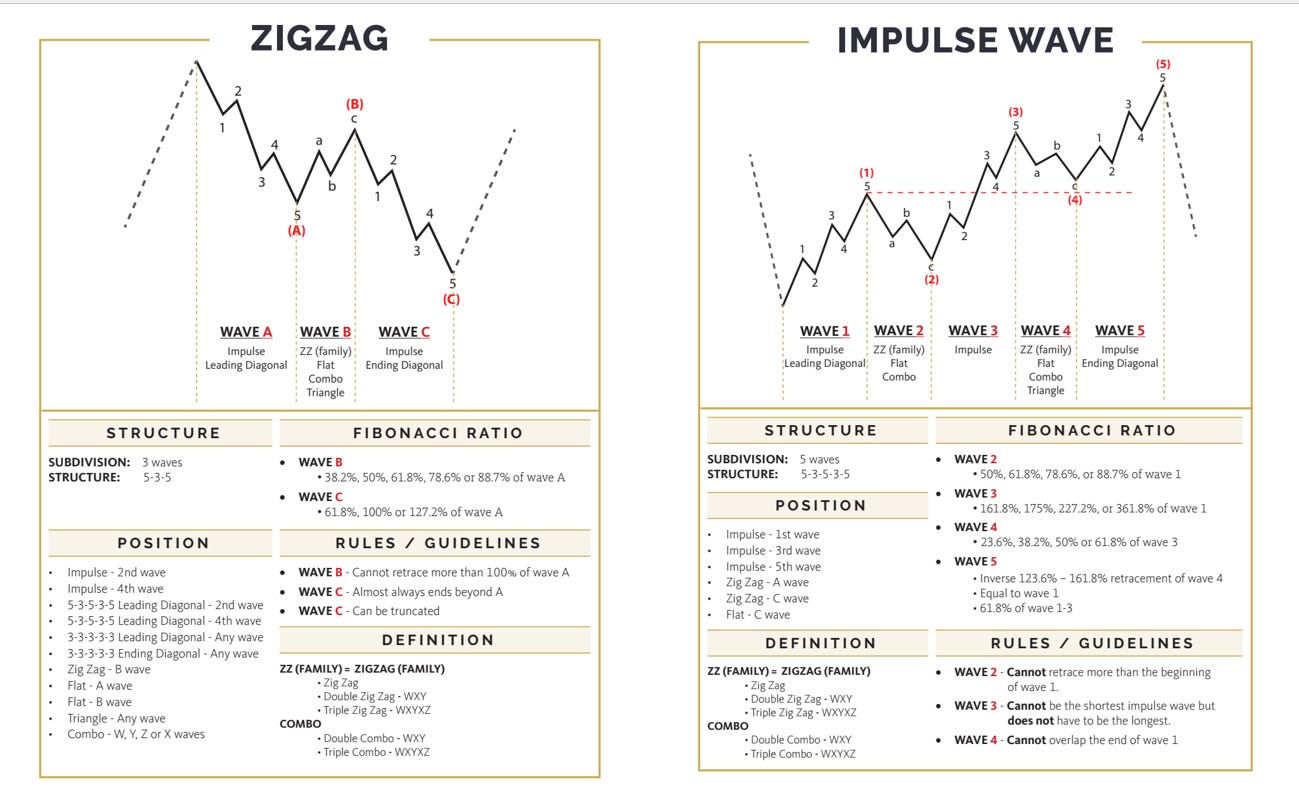
Now compare this with the chart below. The green count shows a zigzag move, and the red count shows an impulse move. The bears want the red move to break the 4325 and form the first trend-changing leg.
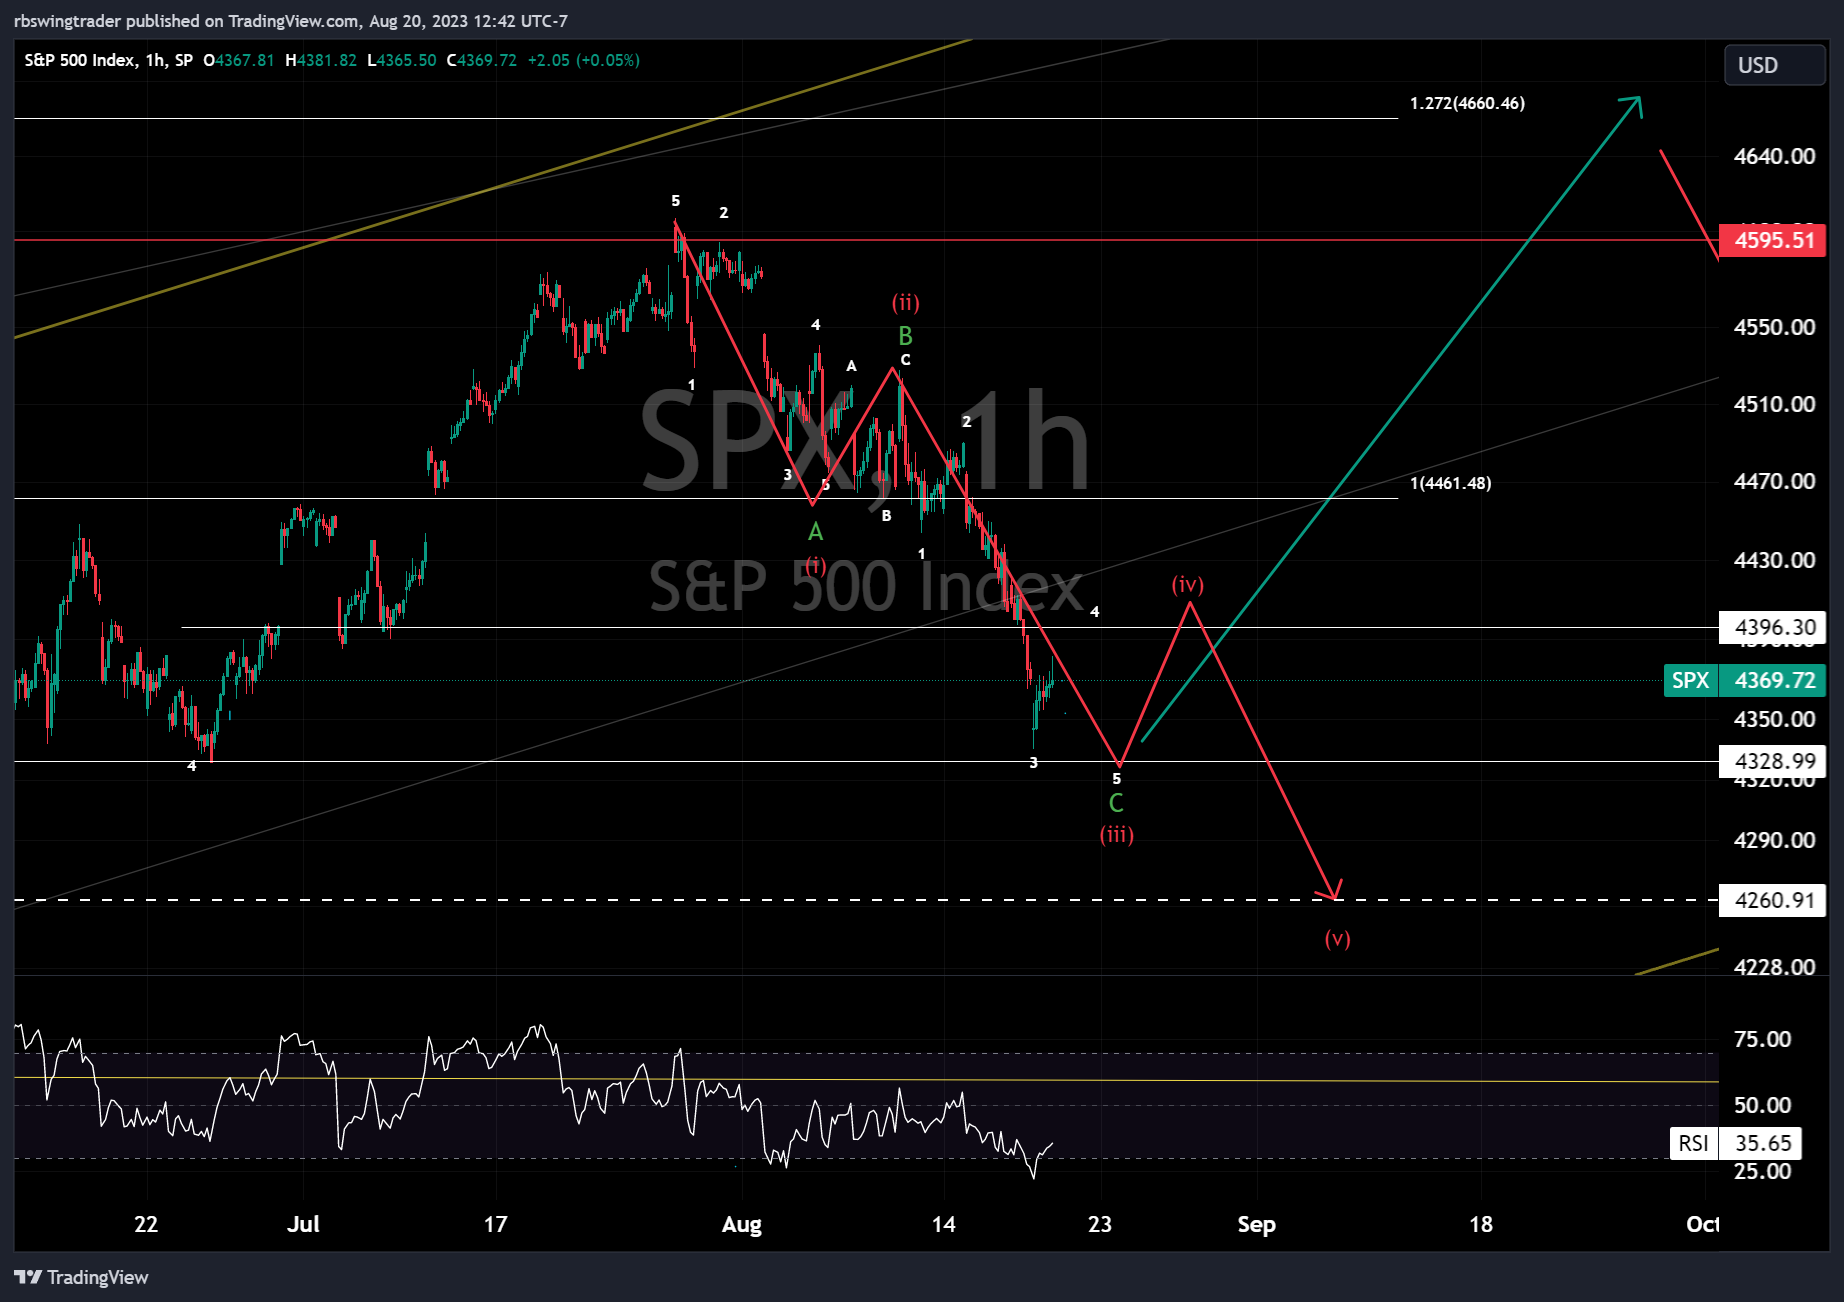
Now, when it comes to trading, if you are scalping moves, then 4394, 4400, and 4412 are the levels to go short, at least for 4325. which is where the green C or the red iii is marked.
Expect another bounce from 4325, and this is where the bulls vs. bear will come into play as that bounce from 4325 should not cross 4460 and ideally the reversal for the red wave v should come from 4410 to send it to 4260. I will update the next steps from there later.
Sorry if it confuses but in short, its bearish as long as 4460 is not breached.
Now, if bears are strong and they breach 4325 as part of red iii and go lower to 4300, that in fact gives edge to bear case even further as that would be a deeper move than what a Zig Zag correction allow as allowed above.
QQQ
Now when I shared before that these indices have moved significantly out of the proportion mainly due to tech sector leading the charge, here is QQQ in the short term where now the drop is heavier and it doesn’t even fit the zig zag criteria. The bear move in this case is this. 360/363 are the main resistance zones and at any time it will not breach 370 as thats the bear invalidation point.
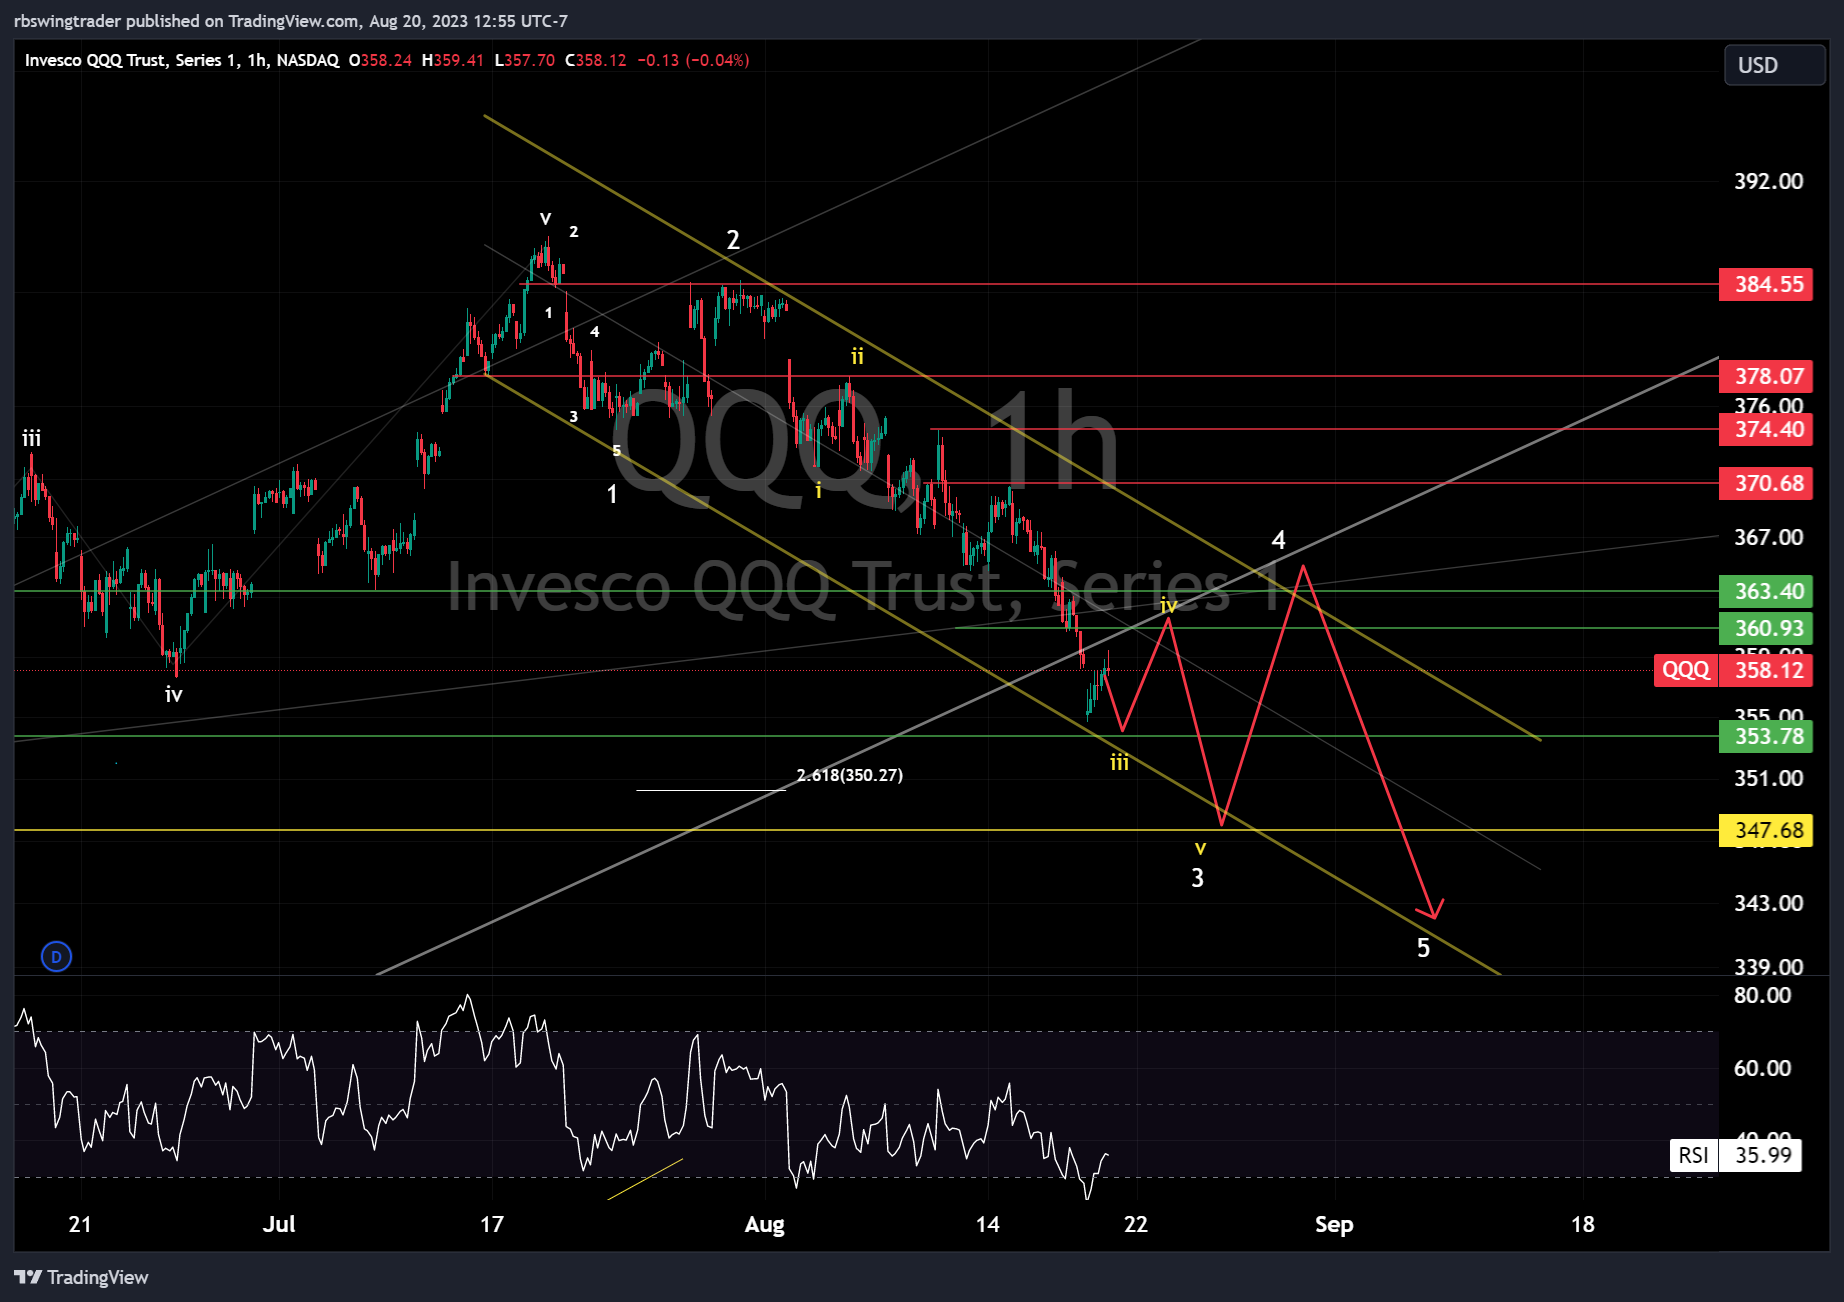
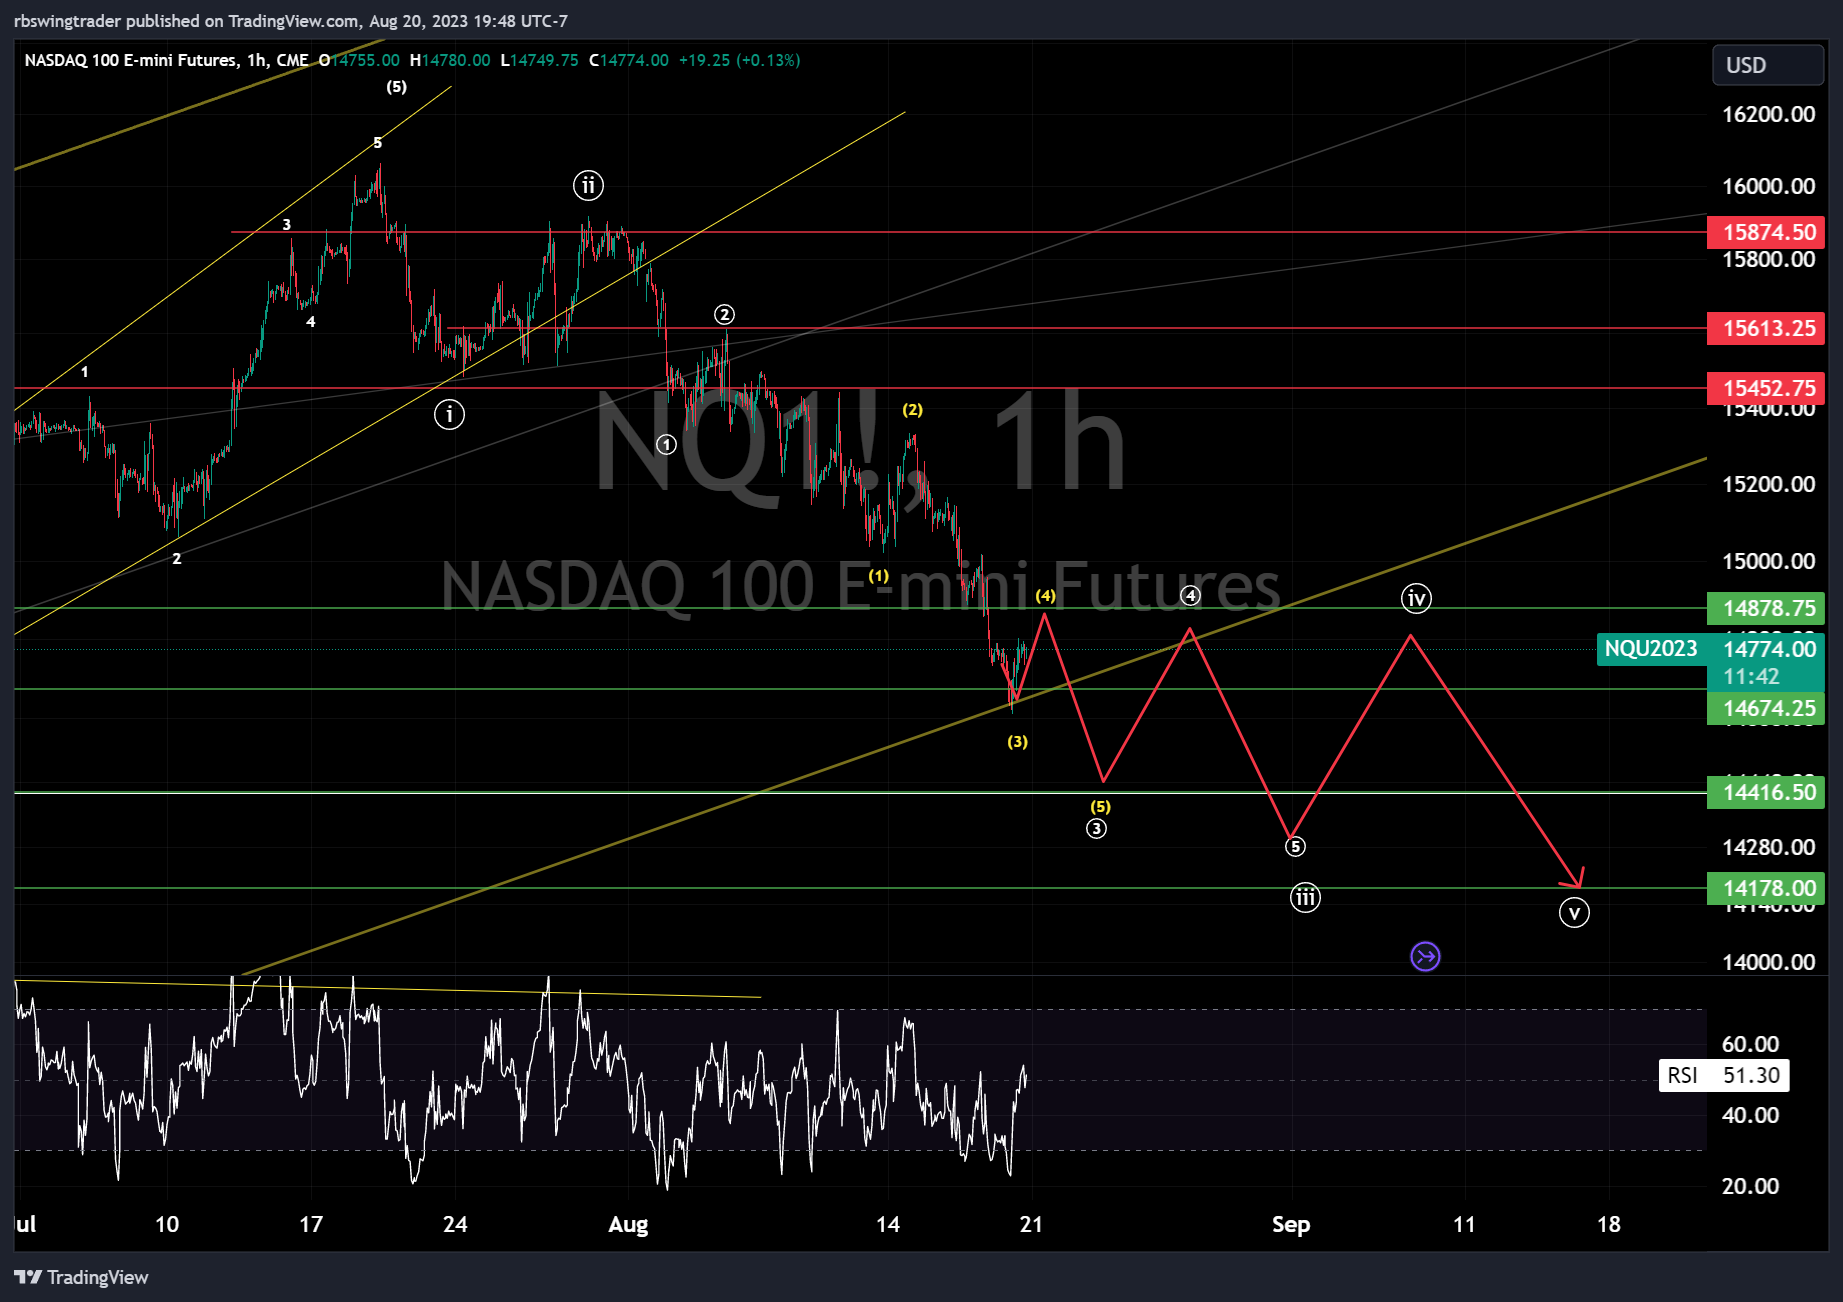
NQ
Similar level and chart as above. Looking at 4875 as the rejection area.
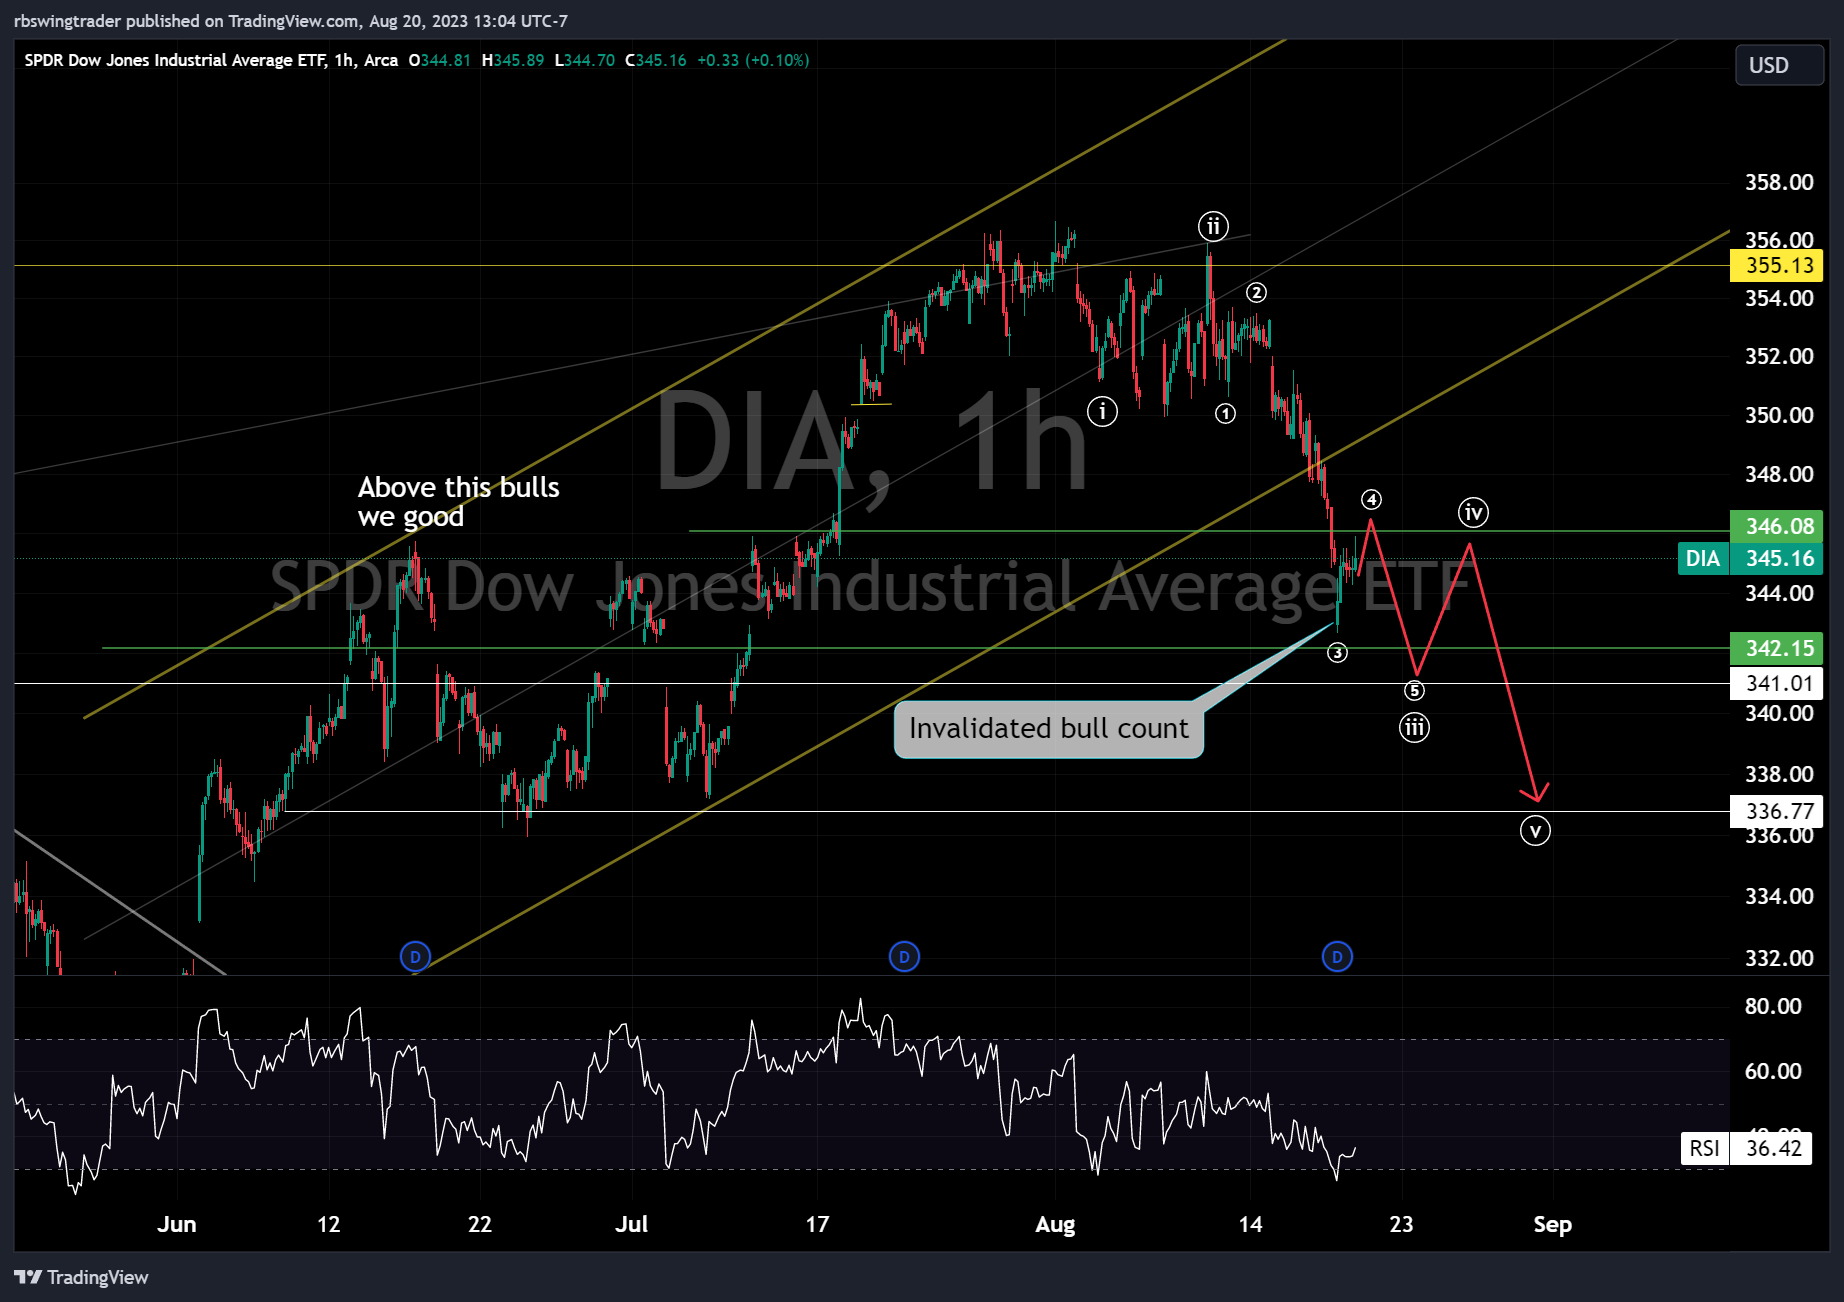
DIA
This one, where I was more bullish last month, has crapped its structure. Very disappointing, but this led me to stop out on longs as bears were getting an edge here. A break of 345 was not good, as that was the key level. For bears, the below move is important to complete, and the 346/348 area is to short for the target of 341 and then 336.
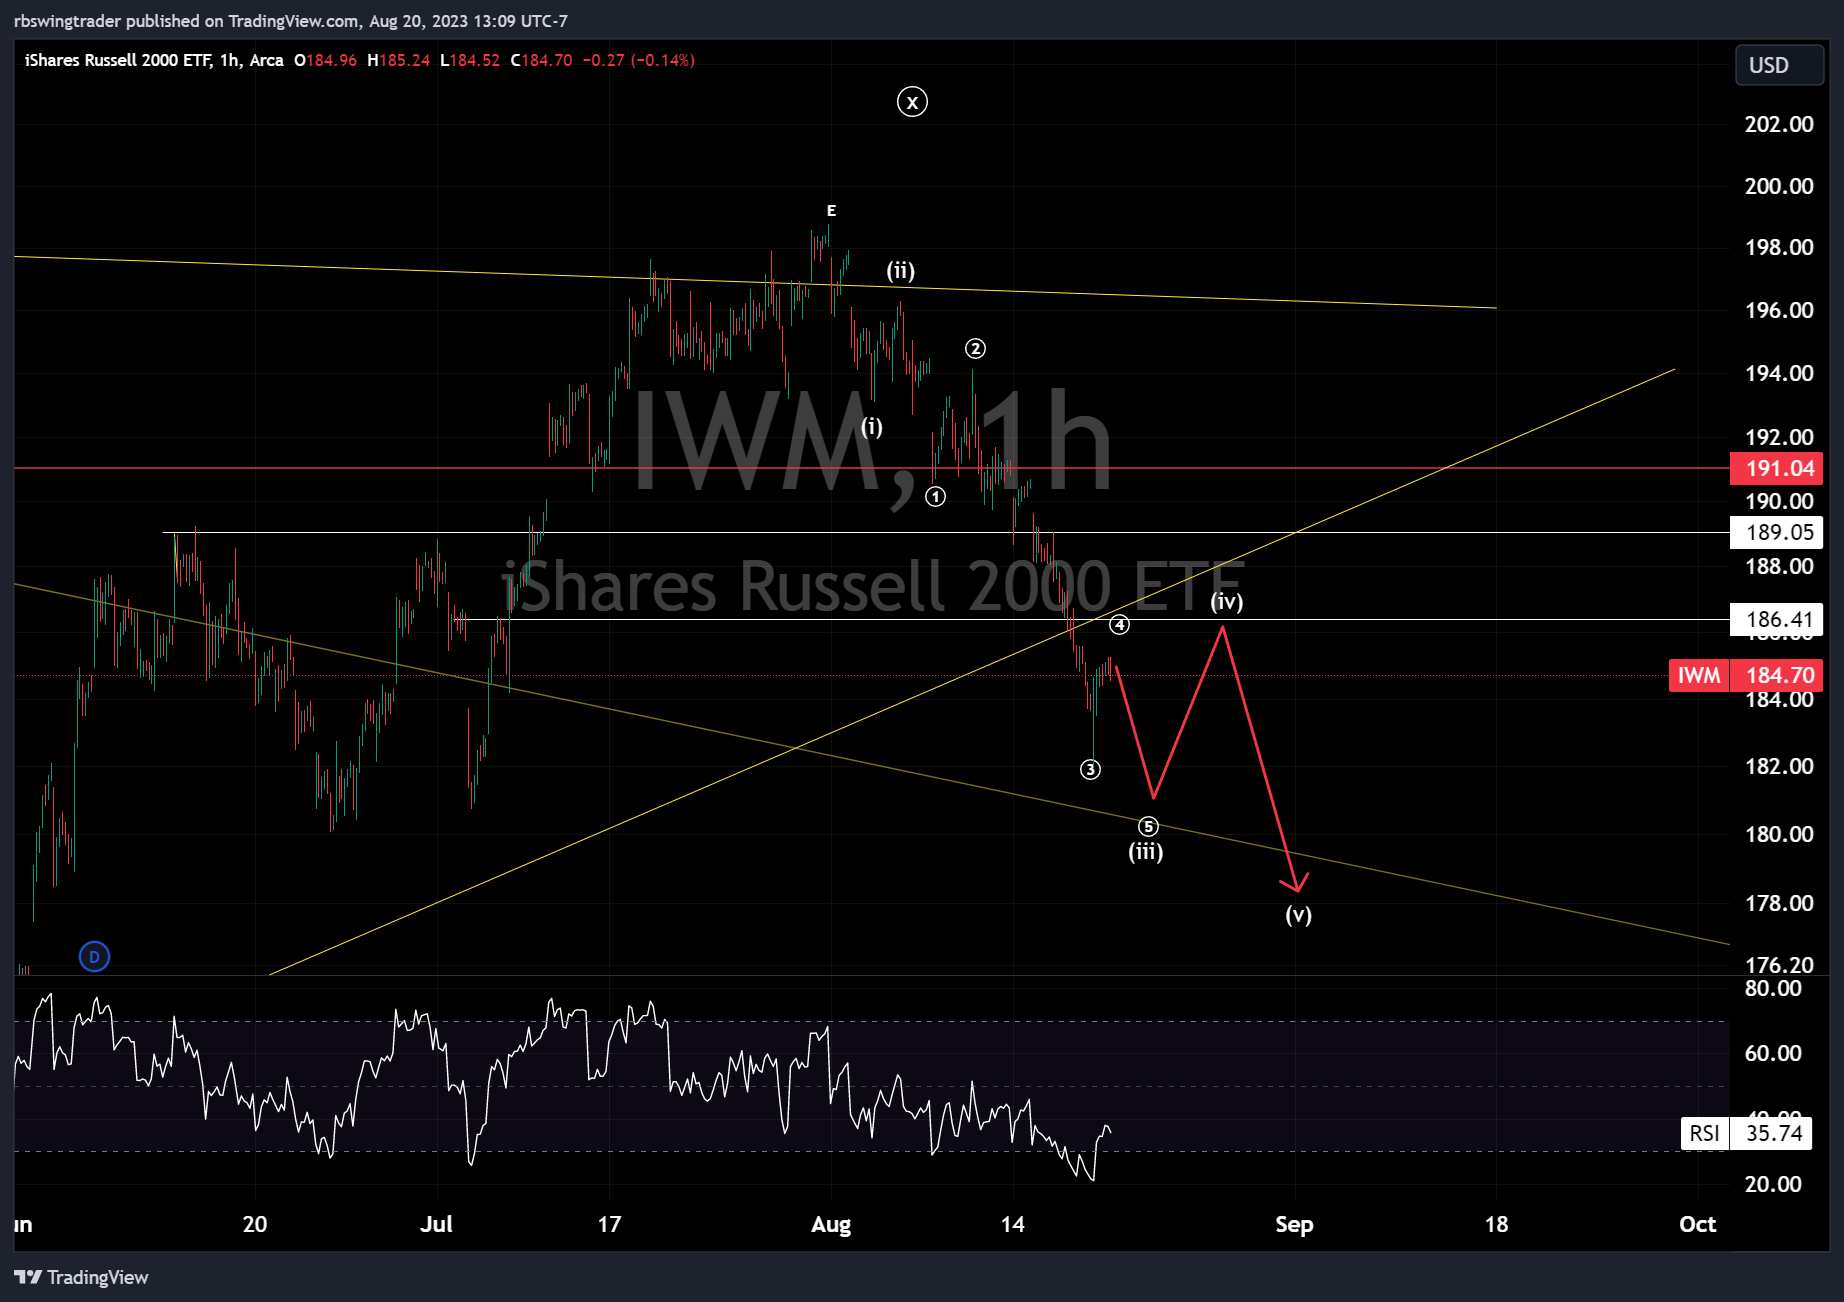
IWM
Another one with a deep sell on the short time frames, and above I shared the long-term count of IWM. You would recall that the IWM count had not been clear for last few weeks, and I was waiting for more information. Now 186 should stay as resistance on this, and any pumps can be shorted here.
This was a lot to digest and very complicated for anyone who is not well versed in EW, but I can tell you one thing: this is the most complex trading year of the last decade as these complex corrections on this scale are not common. We are all living through this, and it’s the best time to learn for everyone. I have so far enjoyed this year despite being tough, as I know this is a once-in lifetime opportunity, and I am blessed that I am able to share this with you all as well.
A trading career is one of the toughest, and every year you will learn something new, so never give up, especially in an year that has wiped out many. Stay in the game and learn it. I have shared a few stocks on Twitter like CRM and DDOG, which I like for shorting, and I am still working on updating the counts but waiting on the confirmation of the indices before I take further steps in building the position.
With this, I conclude this post, and let’s see what happens next week. I will keep you all posted regularly between my posts on Substack as well.
Enjoy the rest of your weekend!
RB
So you think down to 4330 and bounce to 4420 ?
Hi rb
Your waves iii or 5 is at 4330 or 4360 on spx
Its not much clear on the graph
Thank you